Reading our indicator signals and alerts - live trading examples!
Info
![]()
![]() How-to Start Trading
How-to Start Trading
(Click or Tap to expand)
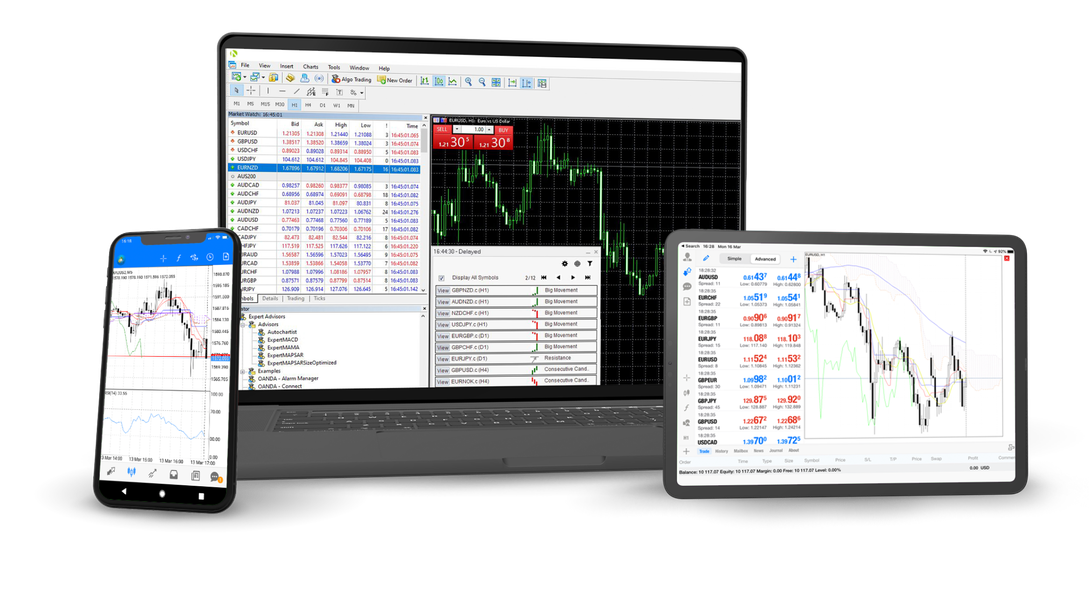
Opening an account with a broker is a prerequisite to trade your preferred instrument, currency pair or a crypto coin. There are lots of brokers out there. When selecting a broker, the key objective is to ensure regulatory compliance and minimal fees, commissions, or spreads. A beneficial factor is their provision of a user-friendly app (desktop or mobile) for swift trade execution, a crucial advantage for intraday trading.
Regular US market session goes from 9:30am to 4pm US Central Time, this goes for stocks, indices, futures and so on. FOREX and Crypto market go around the clock (FOREX actually is closed over the weekend, opening on Sunday 5:00PM ET, closing on Friday 5:00PM ET). Some of our trading strategies include specific Trading Scheduling and some don't. Regardless, our indicators can be automated for any potential Trading Schedule.
Does not really matter. However, it's crucial to differentiate between profitable trading strategies (this is what we build) and the traditional approach to investing in stocks (this is where financial advisors assist). While technical trading strategies can involve both upward (LONG) and downward (SHORT) positions, stock investments typically align with the long-term growth prospects of a company. Trading strategies aim to capitalize on short to medium-term price movements, regardless of the market direction, leveraging both upward and downward trends. On the other hand, traditional stock investing is primarily based on the long-term success and growth of a company, with the expectation that the stock's value will increase over time.
One of the most critical elements in trading is managing risk. For any trading strategy, for consistent profits, it is essential to have:
- SL (Stop-Loss) or EOD(End of Day) Close [trade is closed at the end of the day right before market closes]. Our strategies will always include either one.
- The order size (each trade size) is not that significant as intraday strategies often involve larger trade sizes due to smaller price moves per trade, whereas swing strategies might have smaller trade sizes for more substantial price moves. Each strategy will have an appropriate trade size, generally much smaller than the recommended total capital needed to trade that specific strategy.
-
Ensuring sufficient capital to cover the Max Drawdown, as indicated in the strategy's backtest data + capital to cover the margin (depends on the broker/account) or the strategy single Order Size (each trade size). While it's not guaranteed that the drawdown amount in the future will reach or exceed the backtested maximum drawdown or if there will be drawdown at all, it's advisable to allocate enough capital to cover the calculated maximum drawdown amount from backtesting data. NOTE: If there is not enough capital to cover Max Drawdown, reduce the trade size. With consistent profits - trade size can be gradually increased.
For instance, if a strategy indicates a Net Profit of $20,000 and a Max Drawdown of $5,000 with an Order Size (each trade size) of 50 stocks, and there's insufficient capital to cover the $5,000 drawdown, consider reducing the risk. By decreasing the Order Size (each trade size) to 10 stocks, potential Net Profit may decrease to $4,000, but the potential Max Drawdown would also decrease to $1,000.
Cash Account: With a single order size of $250 and a strategy maximum drawdown of $1,000, it's optimal to start trading with a capital of $1,250.
NOTE: These figures are approximate and very exemplary, but should provide a good estimation of the capital required before trading any strategy.
-
How fast will I be granted access to the Indicator after payment?
In 24-48 hours (usually much faster) -
Can I use my phone for trading?
Absolutely, our trading indicators can be setup using the TradingView mobile app is possible. Regarding actual trading, most regulated brokers offer mobile trading options either through their website or dedicated app, which is the preferred method. This ensures convenient and efficient trading on the go. -
What if I miss a signal/alert?
There will always be another signal/alert, it is always best not to force-enter a trade, "A best trade is - no trade". However, even if a signal or an alert is missed, a custom alert can be created at the entry price of the missed signal. This allows wait for a potential opportunity. Given the typical zig-zag movement of market prices, there's a chance that the price might return to the entry point, enabling entering the trade or position. Even if the price initially moves against the trade, there can even be a potential to enter at a more advantageous point, as long as the trade remains active. This approach capitalizes on the dynamic nature of market trends. -
Are there days when it's best not to trade?
FOMC Meetings and big Holidays. While our algorithms primarily rely on technical analysis and don't factor in fundamentals, it's advisable to consider avoiding trading on days when the Federal Open Market Committee (FOMC) meetings occur. Market behavior during these periods can become irrational and yield unfavorable outcomes. However, it's important to note that all our backtesting is conducted without excluding FOMC days. Therefore, even if there's a negative impact on a specific day, the overall performance should not be significantly affected over the long term. During big holidays - there is simply no volume and almost no price movement. -
Is slippage (commission/spread/fees) accounted for in the algorithm Backtesting?
The level of slippage/commission depends on the specific indicator strategy configuration and the instrument being traded.
Here is what's used in our strategies for most realistic backtesting results:
Instruments Trade Size Fees Crypto (BTCUSD) 1 contract (1BTC on margin) 0.1% commission per trade Futures
(Crypto, Indices, Commodities)
Broker examples: AMP, NinjaTrader1-5 contracts (depending on the # of TPs (Take Profit targets)) $2.50 per 1 contract (round turn basis[per whole trade])
Micro Futures (MICRO S&P500(MES)/MICRO NASDAQ100(MNQ)/MICRO RUSSELL 2000(M2K)).
$5.00 per 1 contract (round turn basis[per whole trade])
Mini Futures (E-MINI S&P500(ES)/E-MINI NASDAQ100(NQ)/E-MINI RUSSELL 2000(RTY)/Light Crude Oil Futures(CL)/Gold Futures(GC)/MICRO BITCOIN(MBT)).FOREX (Currencies) 50,000 contracts (LOTS)
NOTE: 0.01 position size would be 1000 contracts (lots)18 (1.8PIPs spread) slippage
Each Broker has it's own spreads for various currencies, but 1.8 is the most average for regular currency pairs.Stocks
(Indices, Commodities, Stocks)50 contracts (shares) 4 slippage, $0.16 commission per trade
Showed the most realistic results between broker(Charles Schwab) and TradingView strategy tester.
![]() Crypto (BTCUSD, ETHBTC, LTCUSD, etc.)
Crypto (BTCUSD, ETHBTC, LTCUSD, etc.)(Click or Tap to expand)
NO PDT (Pattern Day Trader) restrictions! (Pattern day traders are required to hold $25,000 in their margin accounts. If the account drops below $25,000, they will be prohibited from making any further day trades until the balance is brought back up.)
-
Trading cryptocurrencies can offer several potential benefits, but it's important to note that it also involves risks. Here are some potential benefits of trading cryptocurrencies:
- High Volatility: Cryptocurrencies are known for their price volatility. While this can pose risks, it also provides opportunities for traders to profit from price fluctuations.
- 24/7 Market: Unlike traditional financial markets that have specific trading hours, the cryptocurrency market operates 24/7. This allows traders to react to news and events at any time, providing flexibility in trading.
- Decentralization: Cryptocurrencies operate on decentralized blockchain technology, which means they are not controlled by any central authority, such as a government or financial institution. This can be appealing to those who prefer a decentralized financial system.
- Accessibility: Cryptocurrency markets are accessible to anyone with an internet connection, allowing a more inclusive participation in trading compared to traditional financial markets.
- Diversification: Including cryptocurrencies in a diversified investment portfolio can provide additional opportunities for returns that are not correlated with traditional assets like stocks and bonds.
- Innovative Technology: Many cryptocurrencies are built on innovative blockchain technology, which has the potential to disrupt various industries. Investors may be drawn to the potential long-term value of these technologies.
- Liquidity: Some of the major cryptocurrencies, such as Bitcoin and Ethereum, have high liquidity. This means that large amounts of these assets can be bought or sold without significantly impacting their prices.
- Global Market Access: Cryptocurrencies can be traded on various global exchanges, providing access to a global market. This allows traders to diversify their exposure to different currencies and regions.
- Reduced Transaction Costs: In comparison to traditional financial markets, cryptocurrency transactions can have lower fees, especially for peer-to-peer transactions or when using certain trading platforms.
- Despite these potential benefits, it's crucial to be aware of the risks involved in cryptocurrency trading. The market can be highly speculative, and prices are subject to rapid and unpredictable changes. Traders should conduct thorough research, stay informed about market trends, and manage their risk appropriately.
If located in the US, one of the significant drawbacks is the limited availability of brokers that permit margin trading for cryptocurrencies. Without margin, trading options for well-established coins are constrained.
As an illustration, our trading strategies are primarily designed for the BTCUSD pair with a trade size of 1 Bitcoin. Lack of capital to acquire at least 1 Bitcoin, coupled with the absence of margin, could result in fees consuming potential profits.
As an illustration, our trading strategies are primarily designed for the BTCUSD pair with a trade size of 1 Bitcoin. Lack of capital to acquire at least 1 Bitcoin, coupled with the absence of margin, could result in fees consuming potential profits.
Otherwise, executing the trade is straightforward—buying LONG or selling SHORT 1 BTC in alignment with the indicator alert, considering partial profits if the strategy involves multiple Take-Profit (TP) and Stop-Loss (SL) levels.
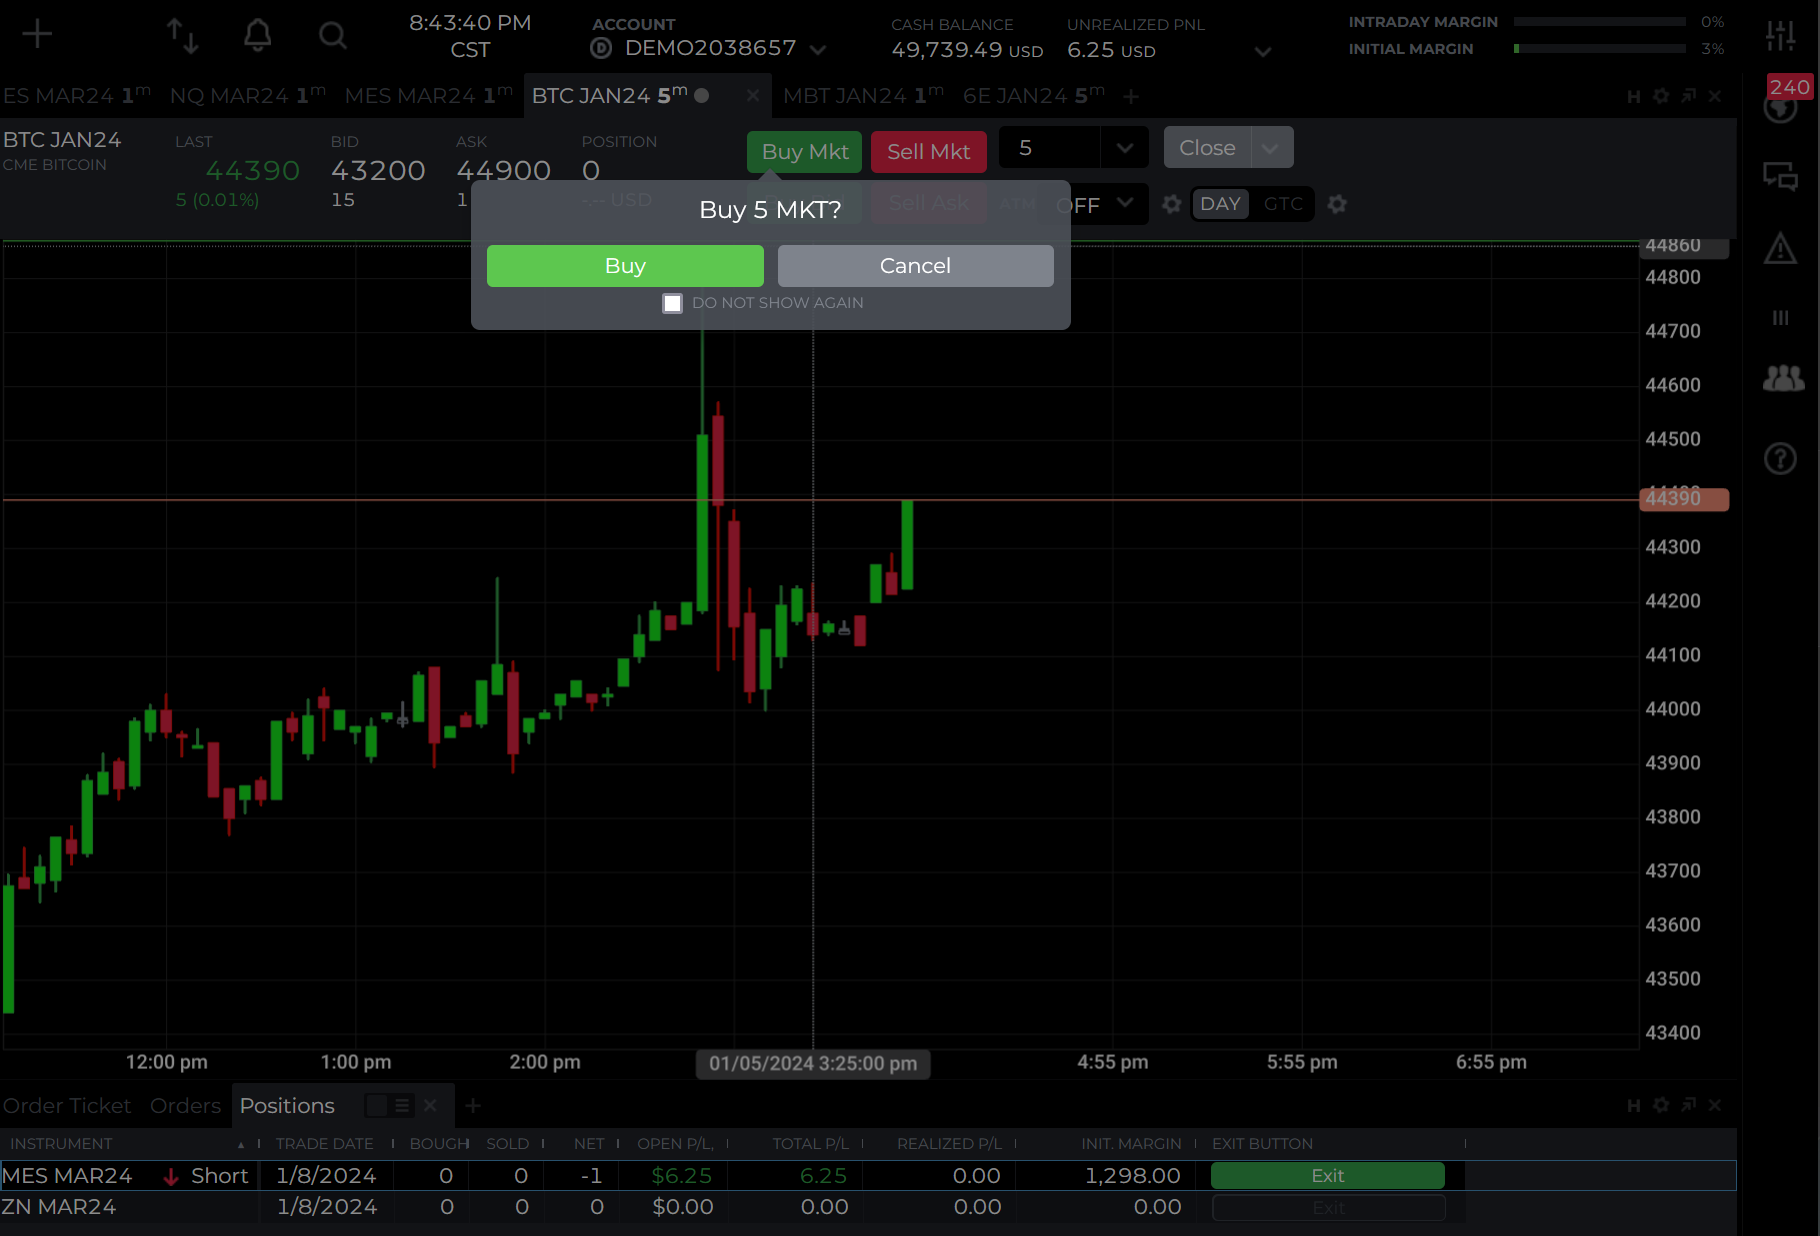
![]() Futures(Crypto/Indices/Commodities)/Binary Options
Futures(Crypto/Indices/Commodities)/Binary Options(Click or Tap to expand)
NO PDT (Pattern Day Trader) restrictions! (Pattern day traders are required to hold $25,000 in their margin accounts. If the account drops below $25,000, they will be prohibited from making any further day trades until the balance is brought back up.)
-
Trading futures contracts offers several potential benefits for investors and traders. Here are some key advantages:
- Leverage: Futures contracts allow traders to control a large position with a relatively small amount of capital. This is known as leverage. While leverage can amplify potential profits, it also increases the risk of significant losses, so it should be used cautiously.
- Hedging: Futures contracts provide a way for individuals and businesses to hedge against price fluctuations in the underlying asset. For example, a farmer might use futures contracts to lock in a price for their crop, protecting against potential price declines.
- Speculation: Traders can use futures to speculate on the future price movements of assets without actually owning the assets. This allows for potential profit in both rising and falling markets.
- Diversification: Futures markets cover a wide range of asset classes, including commodities, currencies, interest rates, and equity indices. This allows traders to diversify their portfolios and manage risk across different markets.
- 24-Hour Trading: Similar to the cryptocurrency market, many futures markets operate 24 hours a day, providing continuous trading opportunities. This can be advantageous for global investors who want to react to news and events outside regular market hours.
- Price Discovery: Futures markets contribute to price discovery by providing a transparent platform where buyers and sellers can agree on future prices. This information can be valuable for market participants and policymakers in understanding the market's expectations.
- Lower Transaction Costs: In some cases, transaction costs for futures trading may be lower than those associated with other financial instruments, especially when compared to certain types of options trading.
- Accessibility to Institutional and Retail Traders: Futures markets are accessible to both institutional and retail traders. This provides a level playing field for a diverse range of market participants.
- Tax Advantages: In some jurisdictions, futures trading may offer tax advantages. For example, traders might be eligible for certain tax treatments on gains and losses.
- Despite these benefits, it's important to acknowledge the risks associated with futures trading, including the potential for significant losses, leverage-related risks, and market volatility. Traders should have a solid understanding of the markets, use risk management strategies, and be aware of the complexities involved in futures trading. Additionally, seeking advice from financial professionals is recommended for those new to futures trading.
Executing the trade is very easy, buy contracts to open LONG or sell contracts to open SHORT. For larger capital, consider utilizing mini-futures, while for smaller amounts, micro-futures could be a suitable option.
Binary Options
Trading binary options differs from trading futures but utilizes the same markets (e.g., US 500, technically ES for CME E-mini S&P 500; US Tech 100, technically NQ for CME E-mini Nasdaq 100), making our trading strategies applicable. However, trading binary options has a learning curve, so it's crucial to fully grasp the concept before engaging. Please refrain from trading binary options without a complete understanding of how they work!
![]() FOREX (Currencies)
FOREX (Currencies) (Click or Tap to expand)
NO PDT (Pattern Day Trader) restrictions! (Pattern day traders are required to hold $25,000 in their margin accounts. If the account drops below $25,000, they will be prohibited from making any further day trades until the balance is brought back up.)
FOREX is one of the easiest markets to start trading. The ability to have very small positions and no intraday trading restrictions allows to trade any strategy style algorithm with just $100!
-
Definition: FOREX trading is buying and selling global currencies. FOREX is traded in pairs - currency is being exchanged - one for another.
FOREX market is open 24hours a day, while closed over the weekend, opening on Sunday 5:00PM ET, closing on Friday 5:00PM ET. -
FOREX Trading: Once currency is bought(example: when buying EURUSD, trader is buying Euros while selling US dollars) or sold (example: when selling EURUSD, trader is selling Euros while buying US dollars) a position or a trade is open:
- If a trader is anticipating euro to go up > EURUSD is bought > LONG(↑) EURUSD position is open (if euro strengthens against the dollar, their position will increase in value | if euro weakens against the dollar, it will decrease in value).
- If a trader is anticipating euro to go down > EURUSD is sold > SHORT(↓) EURUSD position is open (if euro strengthens against the dollar, their position will decrease in value | if euro weakens against the dollar, it will increase in value). -
FOREX terms each trader must know:
-
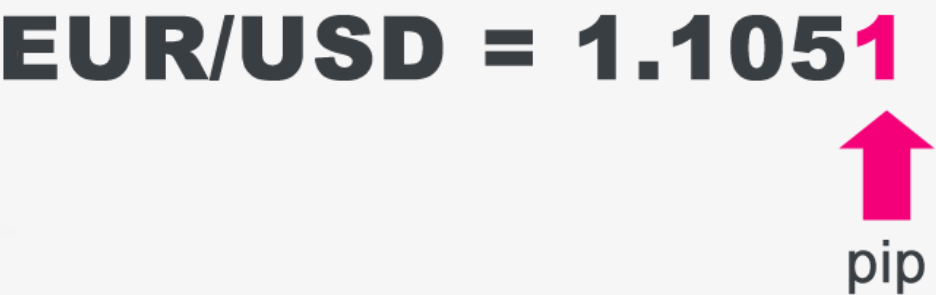
Price Move (PIPs): The unit of measurement to express the change in value between two currencies or the last decimal place of a price quote. Profit or Loss often is measured in PIPs.
-
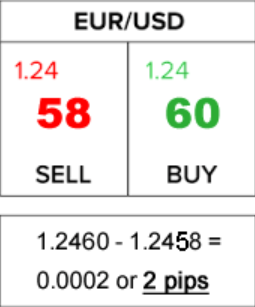
Spread: Spread is the distance between buying and selling price of the currency and it is always against the trader. When trader is buying or selling currency - it's always buying a little more expensive and selling a little more cheaper than it actually is. As can be seen below from a typical EURUSD price data: if EURUSD will be sold - the price would be 58cents, while if bought - the price will be 60cents due to 2PIPs/cents spread. In our algorithms backtesting, spread (can also be called: slippage) is always taken into account.
-
Leverage/Margin: Leverage is the increased “trading power” that is available when using margin account, which is typical when trading FOREX. Leverage allows bigger profits/losses for a very small price fluctuations (currency pair prices usually move very little (bunch of cents/units) during the day and without Leverage - thousands of dollars worth of currency would be needed per each trade for a slight difference in position(profit/loss).
In order to use Leverage - Margin is required. Margin is small amount of capital to open and maintain a new position (For example, if a trader wants to buy $1000 worth of EURUSD, they don’t need to put up the full amount, but only need to put up a portion, like $30).
- Position Sizing (LOTS): In FOREX market, currencies trade in lots called micro (1,000 units of currency), mini (10,000 units of currency), and standard lots (100,000 units of currency). For our Backtesting, we use 5 mini lots (50,000 units of currency), which would require $1,000-1,500 of capital and a margin account. It is suggested to always start trading with micro lots (500units/lots). While there will be tiny profits and losses - it will be enough to grasp the idea of how it all works. Once comfortable, position/trade size can be increased.
-
Price Move (PIPs): The unit of measurement to express the change in value between two currencies or the last decimal place of a price quote. Profit or Loss often is measured in PIPs.
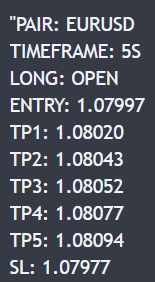
NOTE: Every alert generated by the indicator includes essential levels such as the trade open price, as well as the prices for Take-Profit target(s) and Stop-Loss. Many brokers provide automation tools that enable the automatic closure of trades, either fully or partially, at specified levels. This feature is particularly advantageous for swing trading strategies where a trade may be held overnight or an alert may come in at night (FOREX or Crypto). By leveraging these tools, traders can seamlessly execute the predetermined actions, automatically closing the trade at the Stop-Loss or Take-Profit levels, which are known immediately upon trade opening.
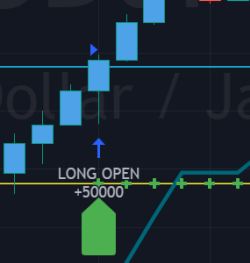
Here is an example of a FOREX USDJPY LONG trade from Open to Close, using our Camarilla Pivots Indicator, where each step of the trade is handled manually.
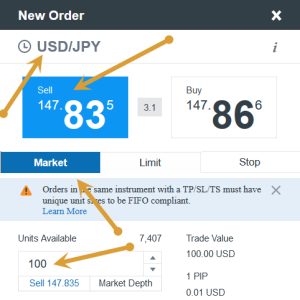
1) FOREX pair USDJPY - LONG signal:
Here is how the position/trade would be open on OANDA's Trading Hub on their website (it will be very similar with other FOREX Brokers):
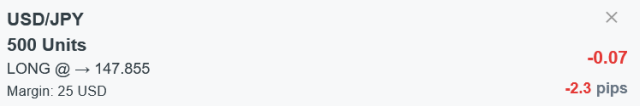
* NOTE: This position/trade will be sized at 500units/lots.
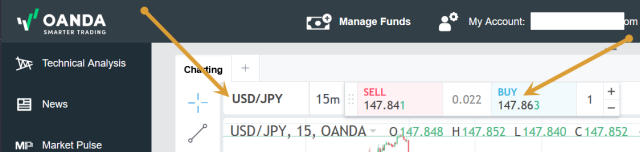
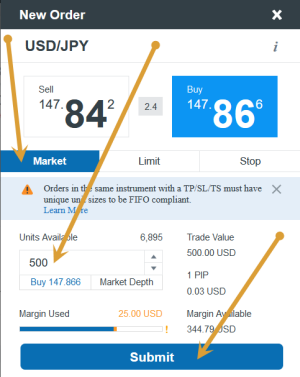
* NOTE: Once a trade is open - it is immediately at a slight loss, because of the spread:
2) FOREX pair USDJPY - TP1 (1st Take Profit Target is hit):
* NOTE: This strategy uses 5 profit targets, this is the 1st one, so only 1/5 of the position/trade needs to be closed (500 / 5 = 100units/lots).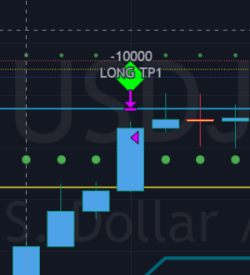
"TP PERCENTAGE" - the amount by which the current trade or position should be decreased, partially closed, or sold.
TP System: Dynamic
"TP PERCENTAGE" - will always be the same amount (trade/position size divided by the # of take-profit(TP) targets) and percentage to be decreased, partially closed, or sold will always be of the ORIGINAL trade/position.
TP System: Static
"TP PERCENTAGE" - will always be the same amount IF take-profit(TP) targets are hit 1-by-1 (TP1 > TP2 > TP3 > TP4 > TP5), otherwise it will vary and unless it is a 1st take-profit(TP1), the REMAINING trade/position size will always be smaller than original and therefore the percentage to be decreased, partially closed, or sold will always be of the REMAINING trade/position and NOT the original one!
TP Percentage Cheat Sheet
- Check your current trade size.
- Multiply it by the decimal value next to "TP PERCENTAGE" received in the signal/alert.
- The result represents the quantity of units, stocks, contracts, etc. that should be reduced, partially close, or sell.
| TP PERCENTAGE | Close/Sell Amount | Example (trade size: 50 stocks) |
|---|---|---|
| 20% | trade size * 0.2 | 50 * 0.2 = 10 stocks |
| 25% | trade size * 0.25 | 50 * 0.25 = 12.5(~13) stocks |
| 34% | trade size * 0.34 | 50 * 0.34 = 17 stocks |
| 40% | trade size * 0.4 | 50 * 0.4 = 20 stocks |
| 50% | trade size * 0.5 | 50 * 0.5 = 25 stocks |
| 60% | trade size * 0.6 | 50 * 0.6 = 30 stocks |
| 66% | trade size * 0.66 | 50 * 0.66 = 33 stocks |
| 75% | trade size * 0.75 | 50 * 0.75 = 37.5(~38) stocks |
| 80% | trade size * 0.8 | 50 * 0.8 = 40 stocks |
| 100% | trade size | 50 = 50 stocks |
In the rare event that a portion of the current or remaining trade closes slightly inaccurately, there's no need for concern. These occurrences are infrequent, and even if there's a minor discrepancy in the partial take profit (TP) closure, it doesn't significantly impact the overall performance of our algorithms.
Reducing position/trade on OANDA's end by 100units/lots:
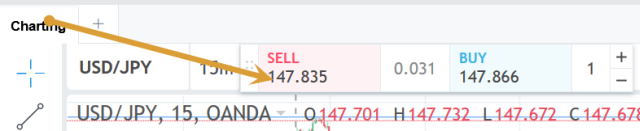
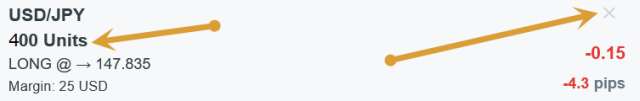
3) FOREX pair USDJPY - SL (Stop Loss is hit):
* NOTE: Position/trade must be fully closed at SL hit!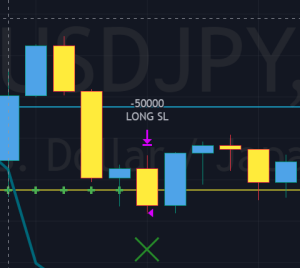
Closing position/trade on OANDA's end (remaining 400units/lots):
![]() Shares/Stocks (Indices/Commodities/Stocks)
Shares/Stocks (Indices/Commodities/Stocks) (Click or Tap to expand)
PDT (Pattern Day Trader) restrictions! (Pattern day traders are required to hold $25,000 in their margin accounts. If the account drops below $25,000, they will be prohibited from making any further day trades until the balance is brought back up.)
Trading stocks and indices as simply buying/selling shares is best for swing/long-term trading strategies. While there's still margin available for day trading, PDT restrictions can pose challenges for beginners or traders with limited capital. Additionally, popular stocks, indices, and commodities can be traded via futures.
![]() Options
Options
(Click or Tap to expand)
What are Options?
-
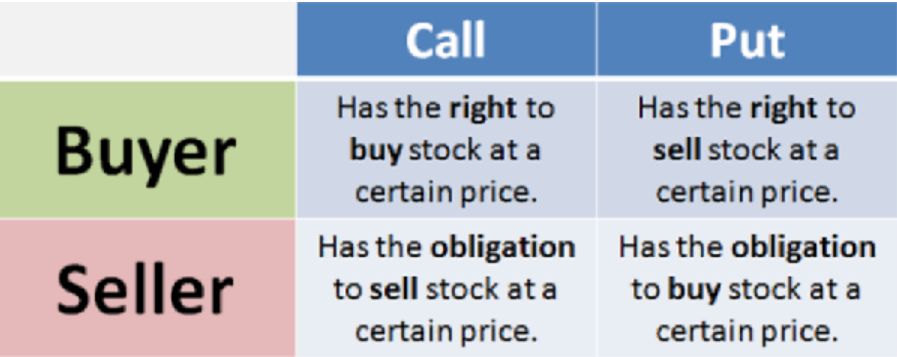
An Option is a contract sold from Seller (writer) to Buyer, which gives buyer the right (but not obligation) to purchase a stock at a specific price - Strike (if stock price is getting closer or breaking beyond the Strike - option contracts increase in value, if stock price goes away from the Strike - options contracts decrease in value), on or before the specified date - Expiration Date (the closer the Expiration Date is - the lower the value of the option contract is (option's time decay), once contracts expire - they become worthless).
-
An Options trade or a position is opened when an option is either bought or sold, which is then closed with an opposite action or when option Expires.
-
BTO (Buy to Open): option contracts are purchased at Ask price. To close such trade, same type of options must be sold STC (Sell to Close) at Bid price unless contracts expire.
-
STO (Sell to Open): option contracts are sold at Bid price. To close such trade, same type of options must be bought back - BTC (Buy to Close) at Ask price unless contracts expire.
- Premium: feed paid by buyer to seller for purchasing options (Premium = 1 contract price * 100).
- Strike Price: predetermined price at which an option can be bought or sold when it's exercised/assigned.
- ITM/OTM/ATM: ITM (In the Money): market price is beyond (Calls: above | Puts: below) the Strike Price. | OTM (Out of the Money): market price is outside (Calls: below | Puts: above) the Strike Price. | ATM (At the Money): market price is equal to Strike Price.
- Expiration Date: option contracts become worthless at the end of trading session day on Expiration date, without reaching the Strike price.
- BE (Break Even) Point: for an options seller, BE (Break Even) price is the stock price at which after contracts expire and the stock is sold(Covered Calls)/bought-to-cover(Covered Puts)/bought(Cash Secured Puts) - there will be no loss or profit. NOTE: When contracts expire the stock price by that point may already be beyond the BE (Break Even) price and not exactly at it, BE (Break Even) is still very useful as it can be used in combo with Technical Analysis. Also, if options contracts are still not expired, exiting out of the trade at BE (Break Even) price will incur a loss of buying the contracts back - BTC (Buy to Close).
- Assignment: obligation to purchase or sell stock shares (100 shares per contract) at the Strike price (considering the stock price is at or beyond the Strike price). Assignment may occur at stock price breaking the Strike price before Expiration or will automatically occur at stock closing at/beyond the Strike price at Expiration date at the end of the trading session day.
- Extrinsic Value: Extrinsic value is the difference between the market price of an option, also known as its premium, and its intrinsic price, which is the difference between an option's strike price and the underlying asset's price. Extrinsic value rises with increase in volatility in the market.
- Intrinsic Value: Intrinsic value is a measure of what an asset is worth. The intrinsic value of both call and put options is the difference between the underlying stock's price and the strike price.
-
BTO (Buy to Open): option contracts are purchased at Ask price. To close such trade, same type of options must be sold STC (Sell to Close) at Bid price unless contracts expire.
-
-
An mentioned before, Option contract typically represents 100 shares of stock per each contract. There are different approaches on selling Options:
- Covered Options: each options contract is backed up by a LONG or a SHORT trade of 100 shares of the underlying stock per 1 contract.
- Cash Secured Options: options contract sold, without owning the underlying stock with available cash to cover the stock purchase in case of assignment.
- Naked Options: options contract sold, without owning the stock or having enough cash to cover the stock purchase in case of assignment.
- Mixed Options: there are various advanced options strategies out there, like spreads, butterflies and so on where different options contracts are bought and sold at the same time.
-
An mentioned before, Option contract typically represents 100 shares of stock per each contract. There are different approaches on selling Options:
-
-
Call option contract: increases in price at stock rise (↑).
- BTO [Buy to Open] - Buyers of calls options are usually expecting the stock to rise rapidly (if price rises slowly > option's time decay will eat away potential profits) in price to re-sell the options at a bigger price.
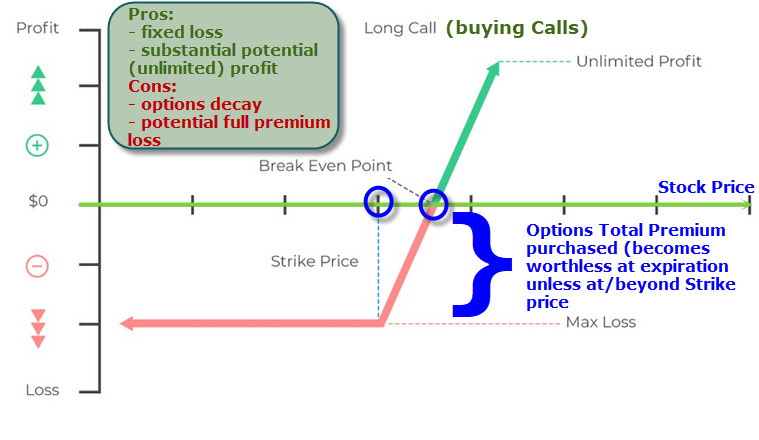
* If stock goes up > buyer can profit by re-selling options at a bigger price before Expiration (can also purchase the stock at Strike price, which usually never happens as buying and then re-selling naked calls is a pure speculation trading approach).
* If stock goes sideways > options will decay by losing its value over time.
* If stock goes down > options will go down in price + lose value over decay.Buying then selling calls is often used as a day trading strategy (LONG trades). With very tight Strike and 1-3 days Expiration date, it allows for more rapid changes in the contract price with minimal stock price movements.
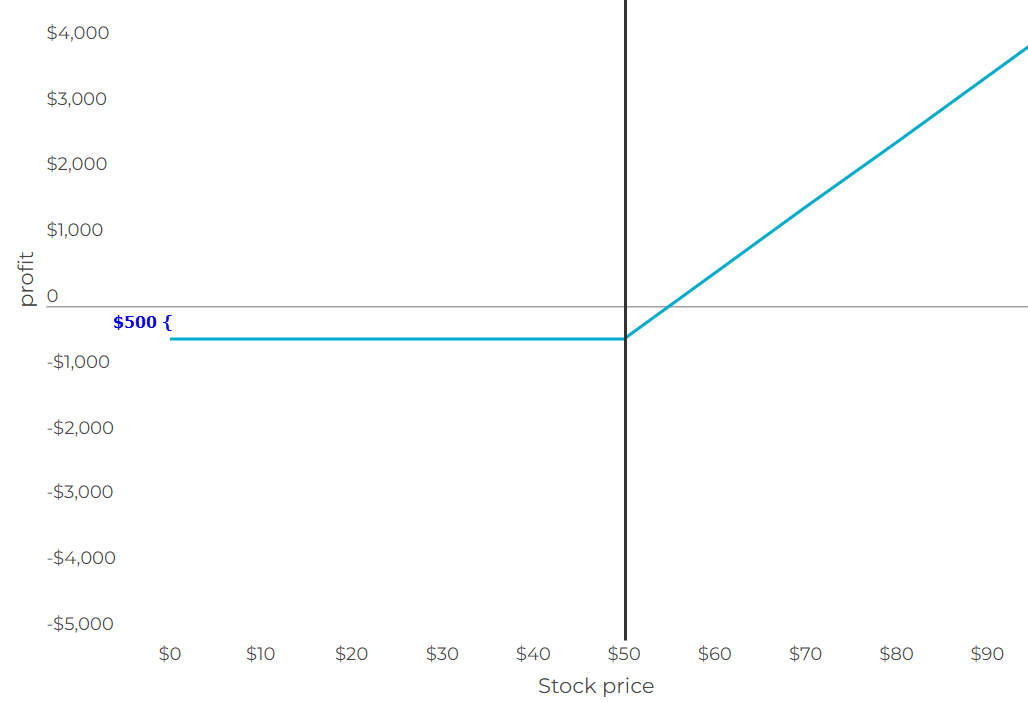
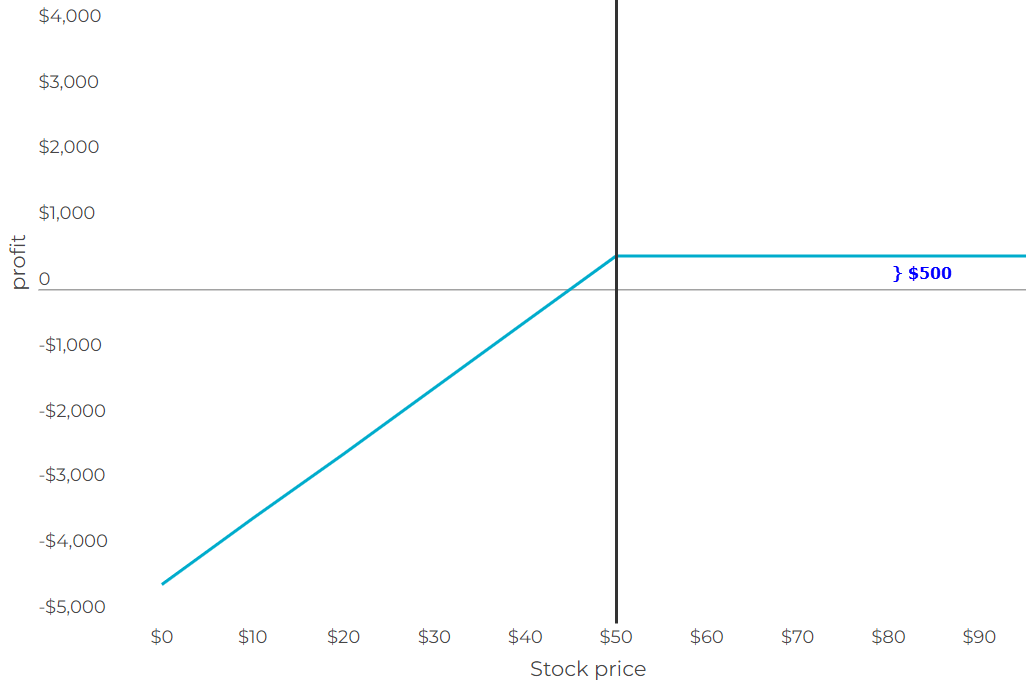
In the given scenario, an AMD call option with a $50 strike price is available for a $5 premium and expires in 3 days. Each call contract, representing 100 shares, costs $500 ($5 premium x 100 shares).
For every $1 increase in the stock price above the $50 strike price, the option's total value increases by $100. The breakeven point, where the option starts to earn money or becomes "in the money," is $55 per share ($50 strike price + $5 call cost). Between $50 and $55, the buyer recoups part of the initial investment, but the option doesn't show a net profit.
Once the option is in the money or above the breakeven point, its value is unlimited because the stock price could continue to climb. If the stock trades below the strike price, rendering the option out of the money, it becomes worthless, capping the investor's maximum loss at the initial outlay of $500.
- STO [Sell to Open] - Sellers of covered calls (secured by 100shares per each contract) options are usually expecting the stock to go sideways/rise (→↑).
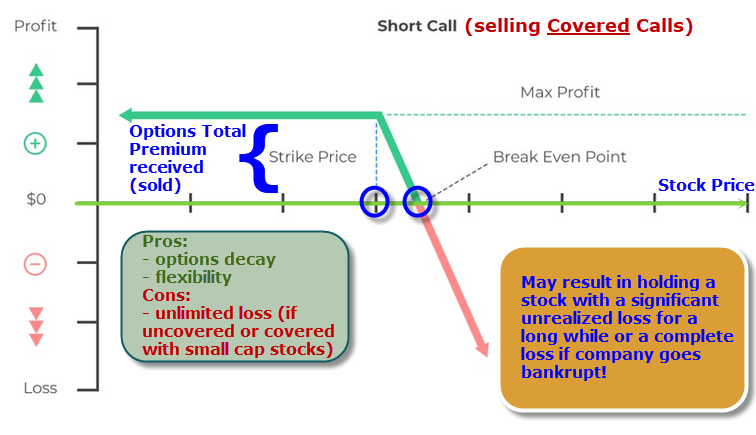
* If at Expiration stock ends up beyond the Strike price > seller keeps the premium received for selling the option contracts and then gets assigned, therefore profiting from premium + difference from selling the stock at a higher price and is left with cash.
* If at Expiration stock never reaches the Strike price > seller simply profits from premium received for selling the option contracts and is left with stock shares.
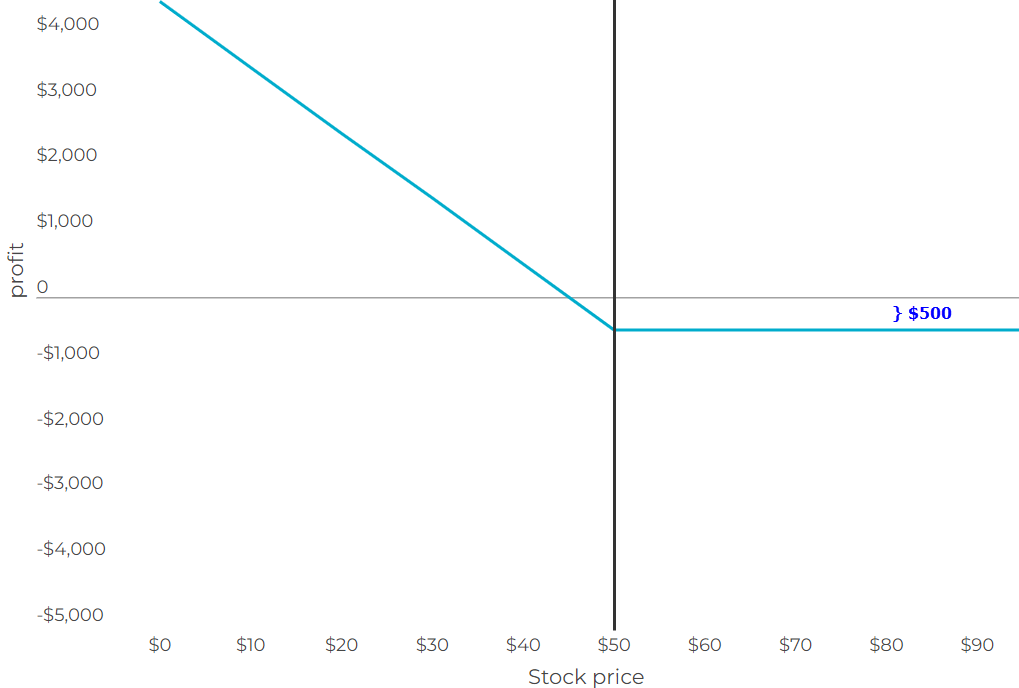
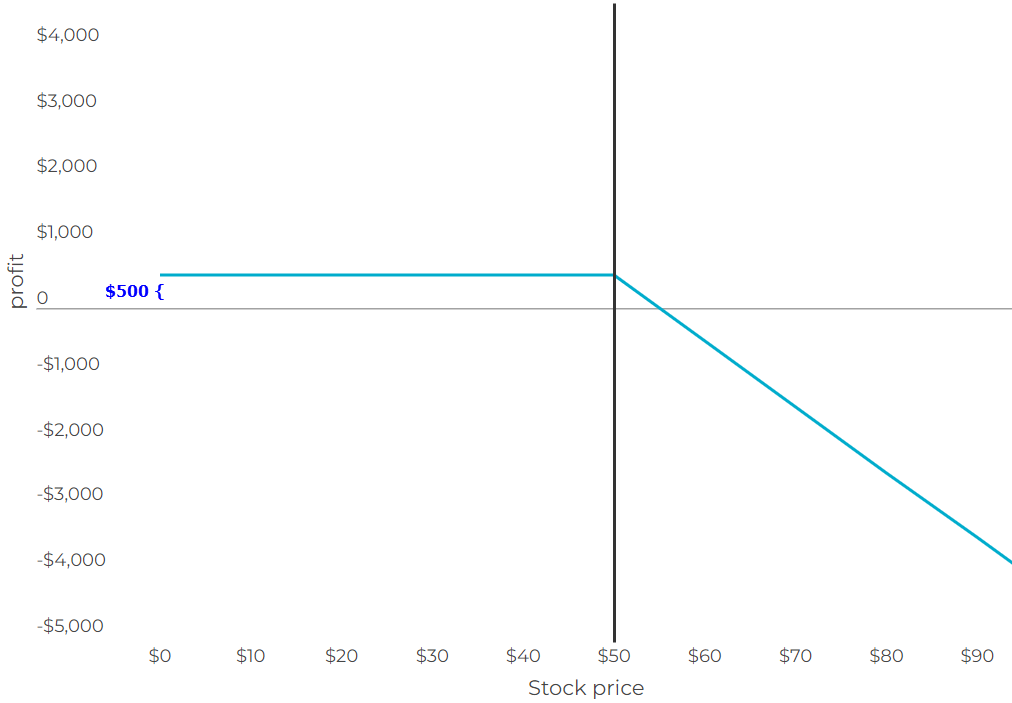
* If at Expiration stock goes below the Stock Purchase Price > seller profits from premium received for selling the option contracts and is left with stock shares, if the stock continues declining > seller may go into an unrealized loss for a long while or even at a complete loss if the company of the stock goes out of business.In the given scenario, AMD stock is trading at $50 a share, and calls with a $50 strike price can be sold for a $5 premium, expiring in 1 week. Each call contract, representing 100 shares, is sold for $500 ($5 premium x 100 shares).
As each contract stands for 100 shares, for every $1 increase in the stock above the strike price, the option's cost to the seller rises by $100. The breakeven point for the call is $55 per share, calculated as the strike price plus the cost of the call. Beyond this point, the call seller begins to incur losses, and potential losses are unlimited. If the stock trades between $50 and $55, the seller retains some premium but not the full amount. If the stock trades below the strike price, the option's value "flatlines", capping the seller's maximum gain at $500.
Call sellers can receive at most the contract premium ($500), but they must be prepared to deliver the stock at the strike price if called by the buyer. Potential losses theoretically have no upper bound if the stock price continues to rise, exposing call sellers to more significant losses than their initial position's premium.
-
Put option contract: increases in price at stock decline (↓).
- BTO [Buy to Open] - Buyers of puts options are usually expecting the stock to decrease in price rapidly (if price falls slowly > option's time decay will eat away potential profits) to re-sell the options it bigger price.
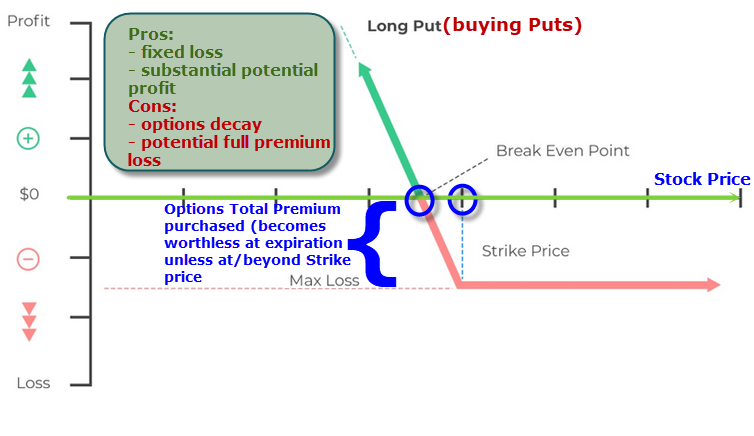
* If stock goes down > buyer can profit by re-selling options at a bigger price before Expiration (can also purchase the stock at Strike price, which usually never happens as buying and then re-selling naked puts is a pure speculation trading approach).
* If stock goes sideways > options will decay by losing it's value over time.
* If stock goes up > options will go down in price + lose value over decay.Buying then selling puts is often used as a day trading strategy (SHORT trades). With very tight Strike and 1-3 days Expiration date, it allows for more rapid changes in the contract price with minimal stock price movements.
AMD, currently valued at $50 per share, has put options with a $50 strike price available for a $5 premium, expiring in 3 days. A single put contract is priced at $500 ($5 premium x 100 shares).
Given that each contract represents 100 shares, for every $1 drop in the stock price below the strike price, the option's total value increases by $100.
Put options start to become profitable, have intrinsic value, or be considered "in the money" when they fall below the break-even point. The break-even point is determined by subtracting the put's cost from the strike price, resulting in $45 in this case ($50 - $5 = $45). If the stock trades between $45 and $50, the option retains some value but doesn't yield a net profit.
On the other hand, if the stock remains above the $50 strike price, the option is deemed "out of the money" and becomes worthless. Consequently, the option value remains flat, limiting the investor's maximum loss to the premium paid for the put, which is $5 per share or $500 in total.
- STO [Sell to Open] - Sellers of covered puts (secured by 100shares per each contract) options are expecting the stock to go sideways/decline in price (→↓).
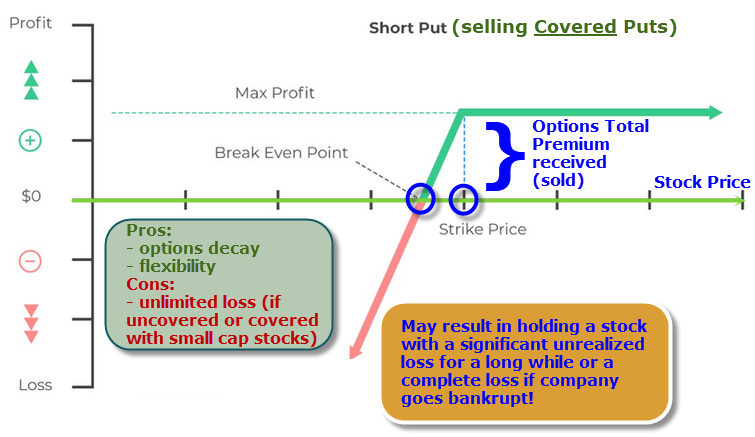
* If at Expiration stock ends up beyond the Strike price > seller keeps the premium received for selling the option contracts and then gets assigned, therefore profiting from premium + difference from short-selling the stock at a lower price and is left with cash.
* If at Expiration stock never reaches the Strike price and never goes above the Stock Purchase price (as there is a still short trade open) > seller simply profits from premium received for selling the option contracts.
* If at Expiration stock goes above the Stock Purchase Price > seller profits from premium received for selling the option contracts and is left with stock shares, AND with an open short trade, which is at loss, since it is a short-sold stock, which went up in price since purchase. With stock never declining below the short-sell price - it will have to be bought-to-cover (basically close the trade) at a loss as if stock continues going up - the loss can grow unlimited!AMD, trading at $50 a share, has put options with a $50 strike price that can be sold for a $5 premium, expiring in 1 week. One put contract is sold for $500 ($5 premium x 100 shares).
Each contract, representing 100 shares, results in a $100 increase in cost to the seller for every $1 decrease in the stock below the strike price. The break-even point is $45 per share, calculated as the strike price minus the premium received. The maximum profit for the put seller is capped at $5 premium per share, totaling $500. If the stock remains above $50 per share, the put seller retains the entire premium. As the stock declines, the put option incurs increasing costs for the seller.
Unlike put buyers, put sellers have limited upside and substantial downside. The maximum amount the put seller can receive is the premium of $500. However, if the buyer exercises the put option, the put seller must buy 100 shares of stock at the strike price. Potential losses could exceed the initial investment, reaching the entire value of the stock if it goes to $0. In this scenario, the put seller could incur a loss of up to $5,000 ($50 strike price paid x 100 shares) if the underlying stock reaches $0, as illustrated in the graph.
- [Sell to Open] - Sellers of cash secured puts options are expecting the stock to go sideways/rise to simply collect the option premium.
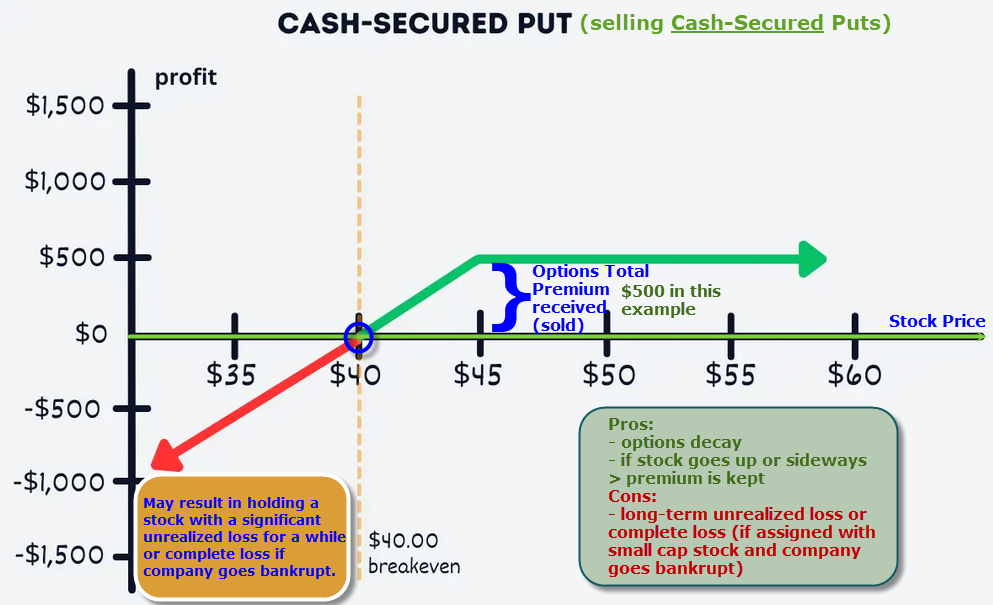
* If at Expiration stock never reaches the Strike price > seller simply profits from premium received for selling the option contracts.
* If at Expiration stock ends up beyond the Strike price > seller keeps the premium received for selling the option contracts and then gets assigned, therefore profiting from premium, while obtaining 100 shares per each contract at the Strike price. NOTE: If at Expiration stock ends up below the Strike price (actually below and not exactly at it) - seller ends up holding a stock at unrealized loss and if the stock will not recover above Strike price soon - seller may end up at an unrealized loss for a long while or even at a complete loss if the company of the stock goes out of business.
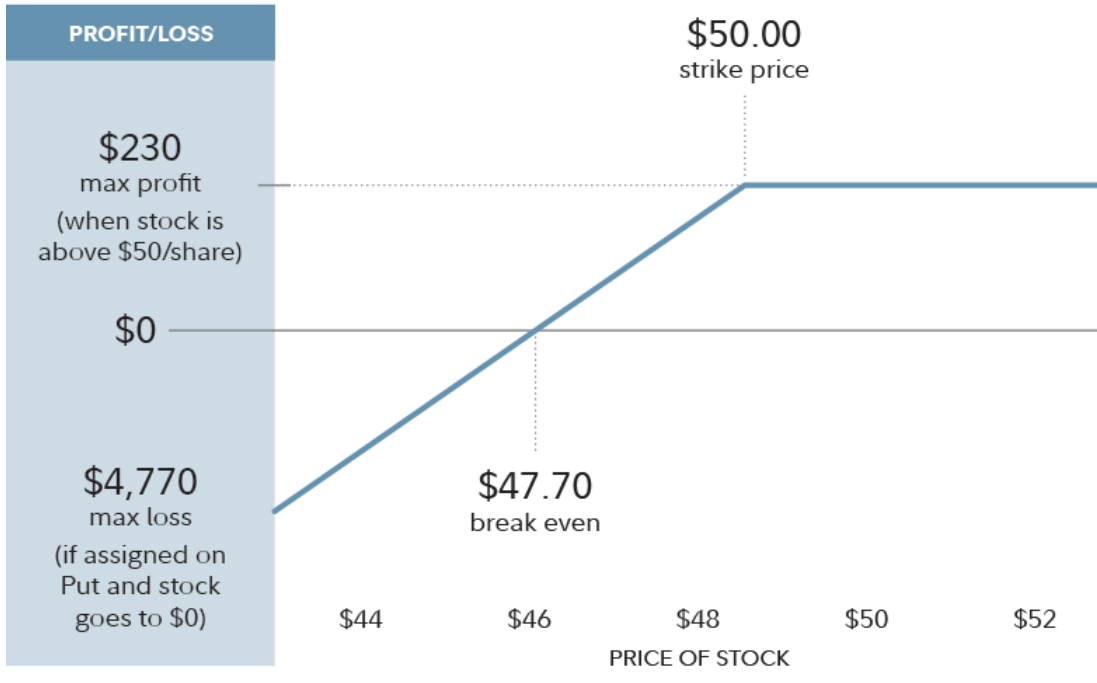
AMD, trading at $75 a share, has put options with a $50 strike price that can be sold for a $230 premium ($2.30 premium x 100 shares), expiring in 1 week.
If, at expiration, the stock is valued above $50 per share, the put option likely expires worthless, and you keep the premium. There's no obligation to purchase 100 shares of AMD, and you don't participate in additional profits if the stock continues to rise.
If the stock is below $50 at expiration, the contract is likely assigned, and you will buy 100 shares of AMD. The shares are automatically purchased at the strike price of $50, but since you received $2.30 per share from selling the contract, your effective purchase price is $47.70 per share. After this, your gain or loss is based on the movement of AMD shares relative to your purchase price.
-
Call option contract: increases in price at stock rise (↑).