This indicator supports autotrading.
(Click or Tap to learn more)
(Click or Tap to learn more)


Camarilla Pivots with Signal Clean Up Analysis
- Deep Backtesting feature allows to see if there is a long-term potential in a strategy
- Great for any trading style, for any instrument: Indices, Stocks, Commodities, Forex, Crypto
- Full-cycle trading system, with labels and alerts from trade open to trade close
- Provides TP (Take-Profit) and SL (Stop-Loss) levels at trade open alert
- Every calculation is done on a confirmed closed candle bar, so the indicator will never repaint
- Works with all popular timeframes for any trade style: 1M, 3M, 5M, 15M, 30M, 1H, 4H, D.
NOTE: At position open - there will be calculated Take-Profit and Stop-Loss targets, however each target is considered hit, when candle bar closes breaking that target, so Take-Profit and Stop-Loss when hit will slightly differ then levels at position open!
Our product stands out by providing Backtesting results for every Trading Strategy, validating the potential of our algorithms. While there's inherent risk in any investment and our approach is certainly riskier than 1.5-5% Certificate of Deposit (CD), it offers more promising outcomes based on historical patterns. This potential is notable in cryptocurrencies, futures, FOREX pairs, indices, stocks and commodities.
|
Futures(Crypto/Indices/Commodities)
|
||||||||||
293% profit in 1 year 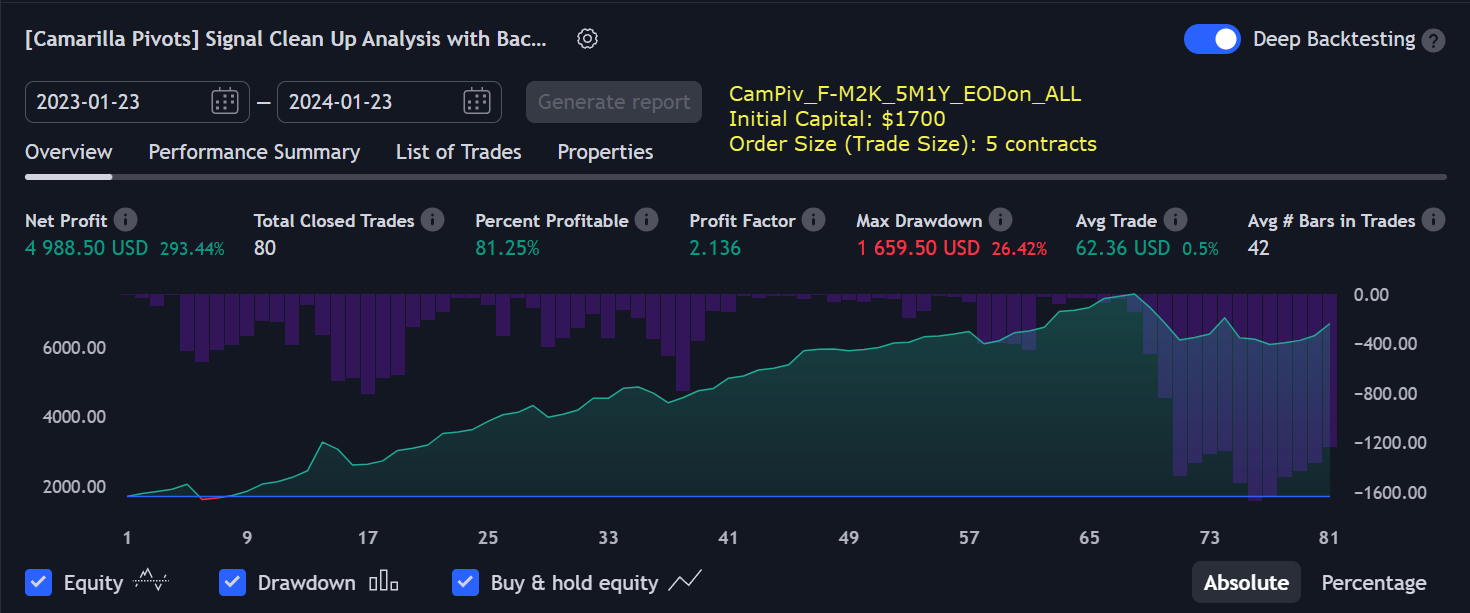
|
||||||||||
381% profit in 1 year 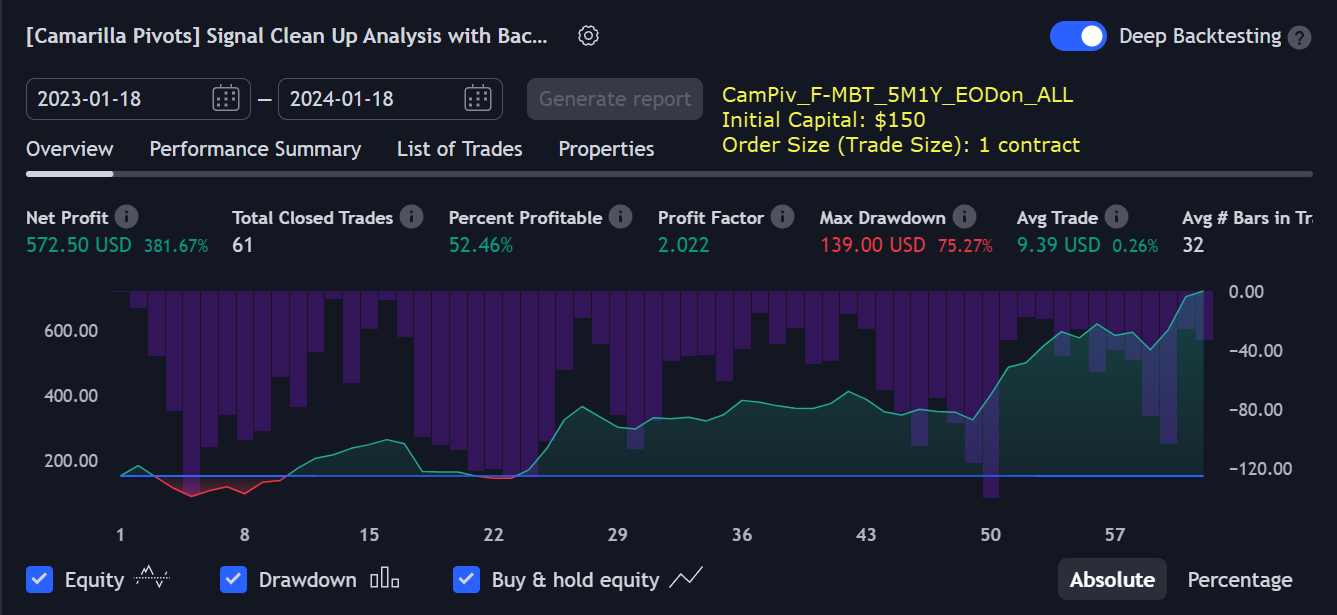
|
||||||||||
597% profit in 2.5 years 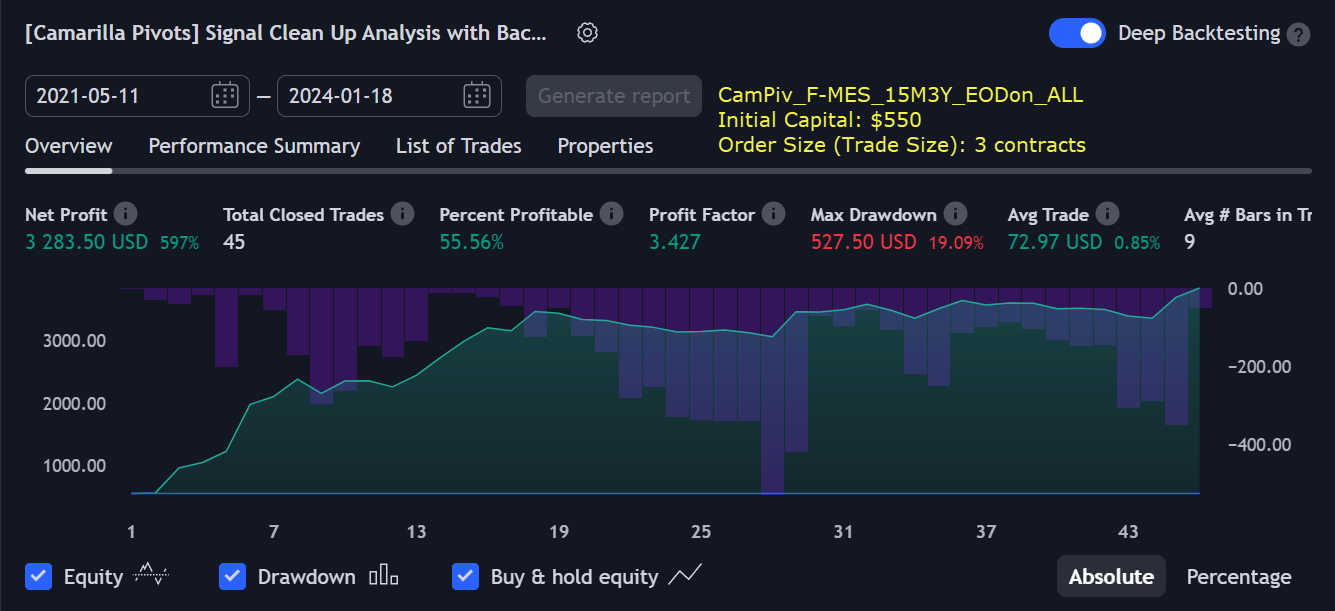
|
||||||||||
702% profit in 2.5 years 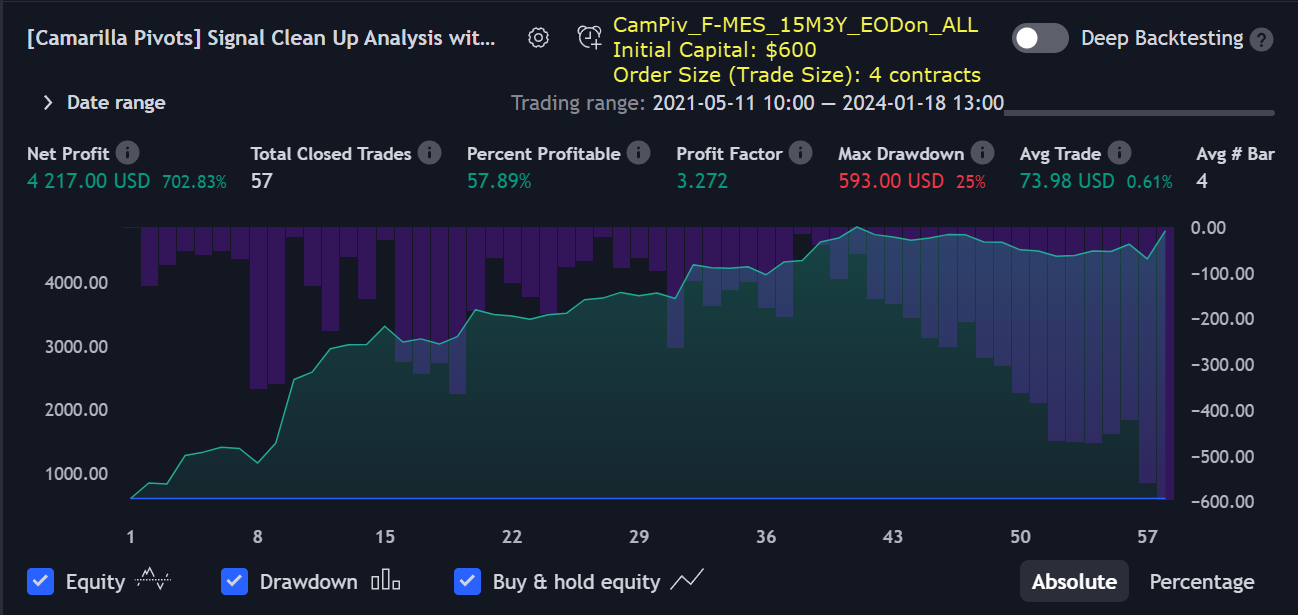
|
||||||||||
412% profit in 1 year 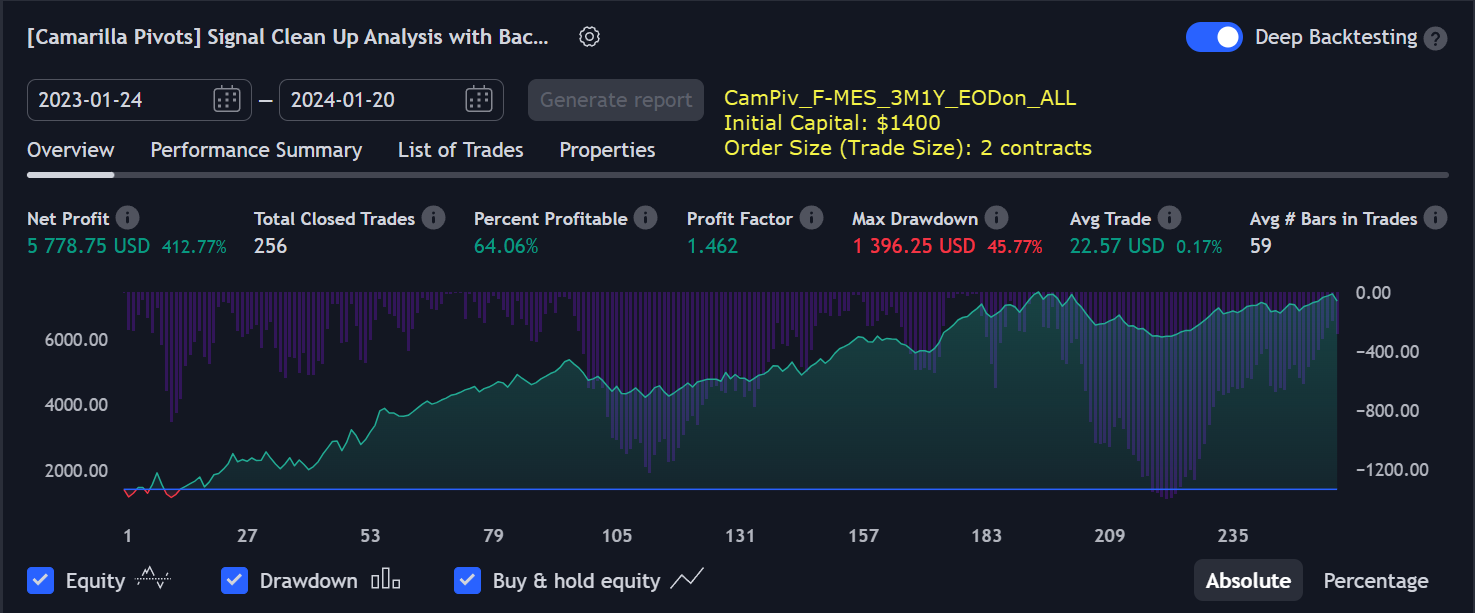
|
||||||||||
450% profit in 3 years 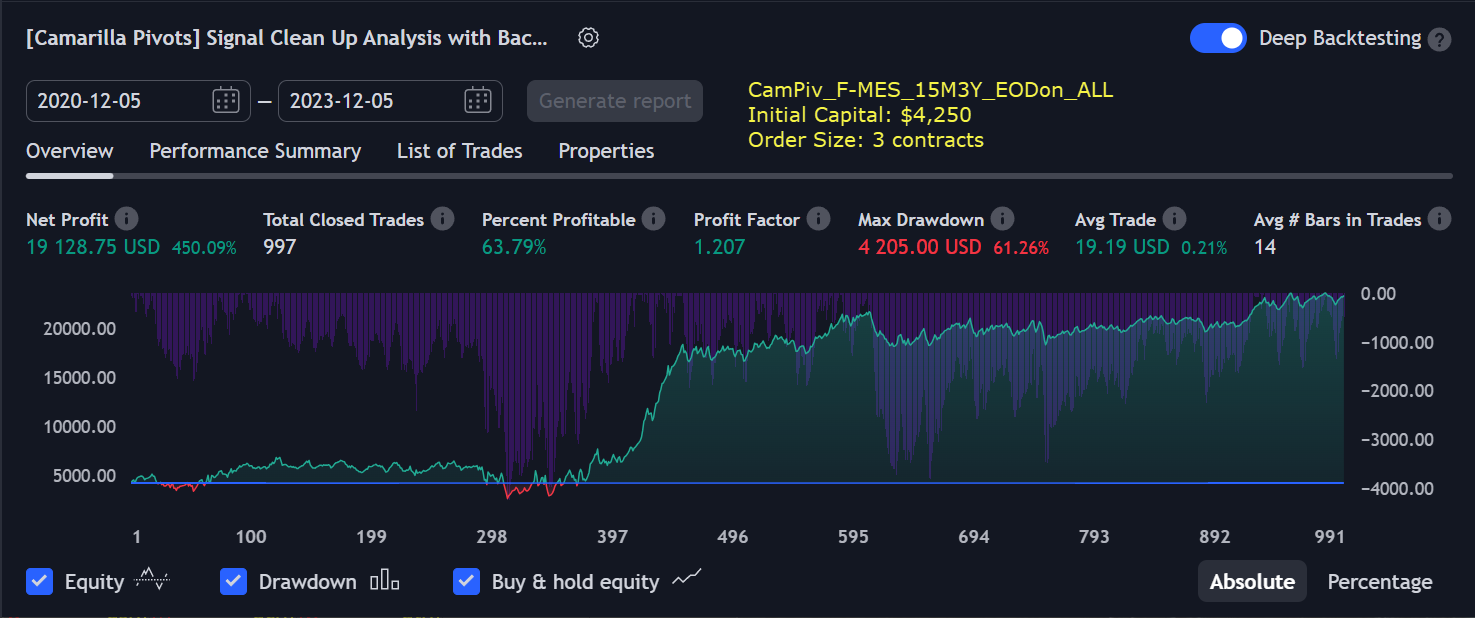
|
||||||||||
1039% profit in 3 years 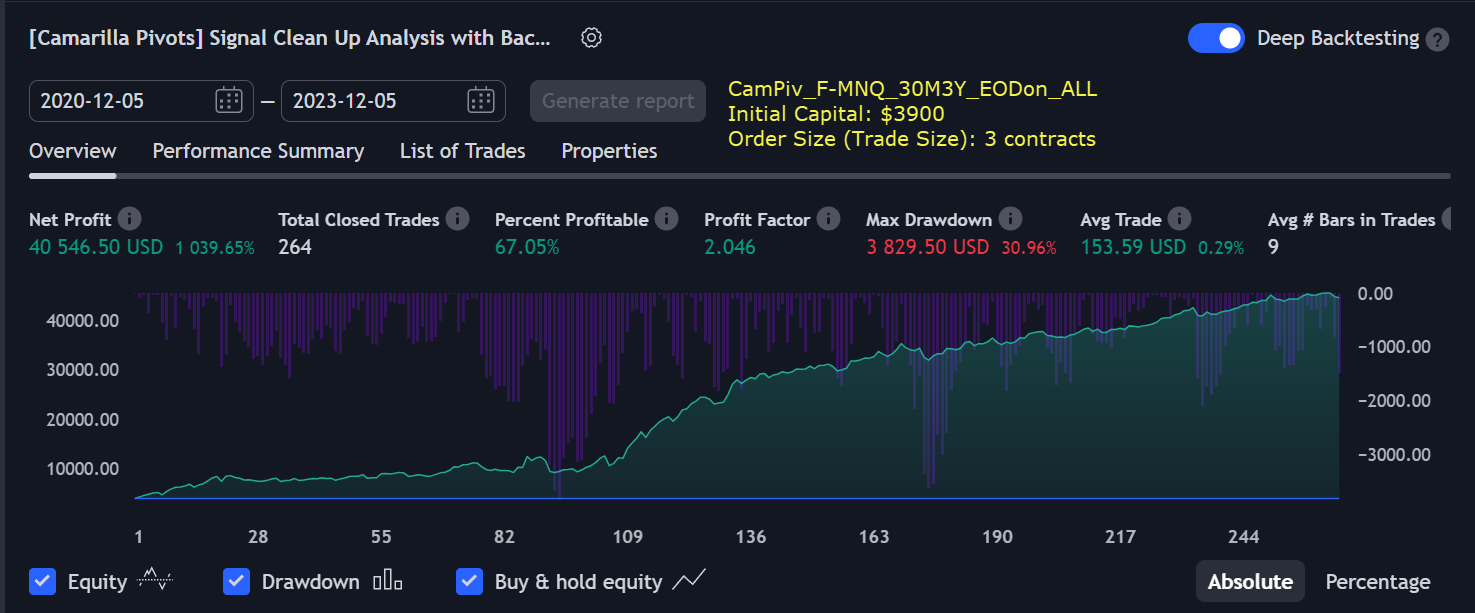
|
||||||||||
|
Shares/Stocks (Indices/Commodities/Companies)
|
||||||||||
516% profit in 3 years 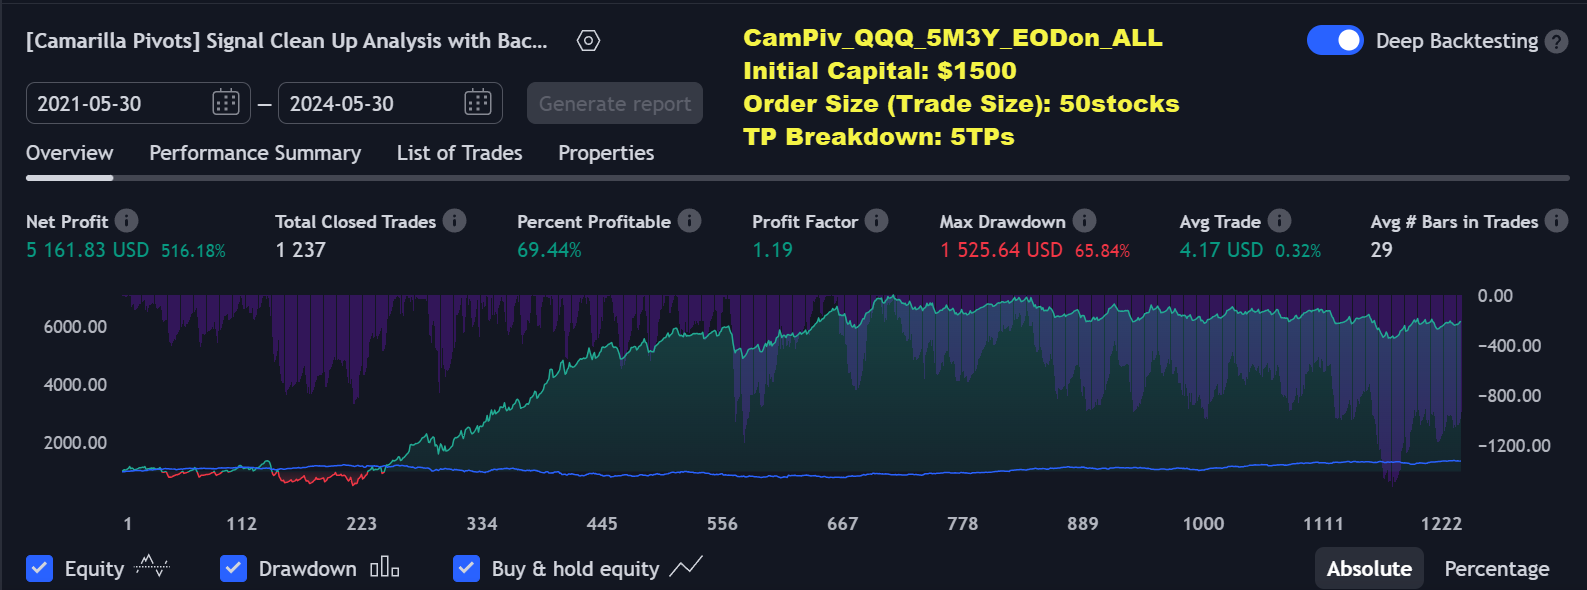
|
||||||||||
569% profit in 3 years 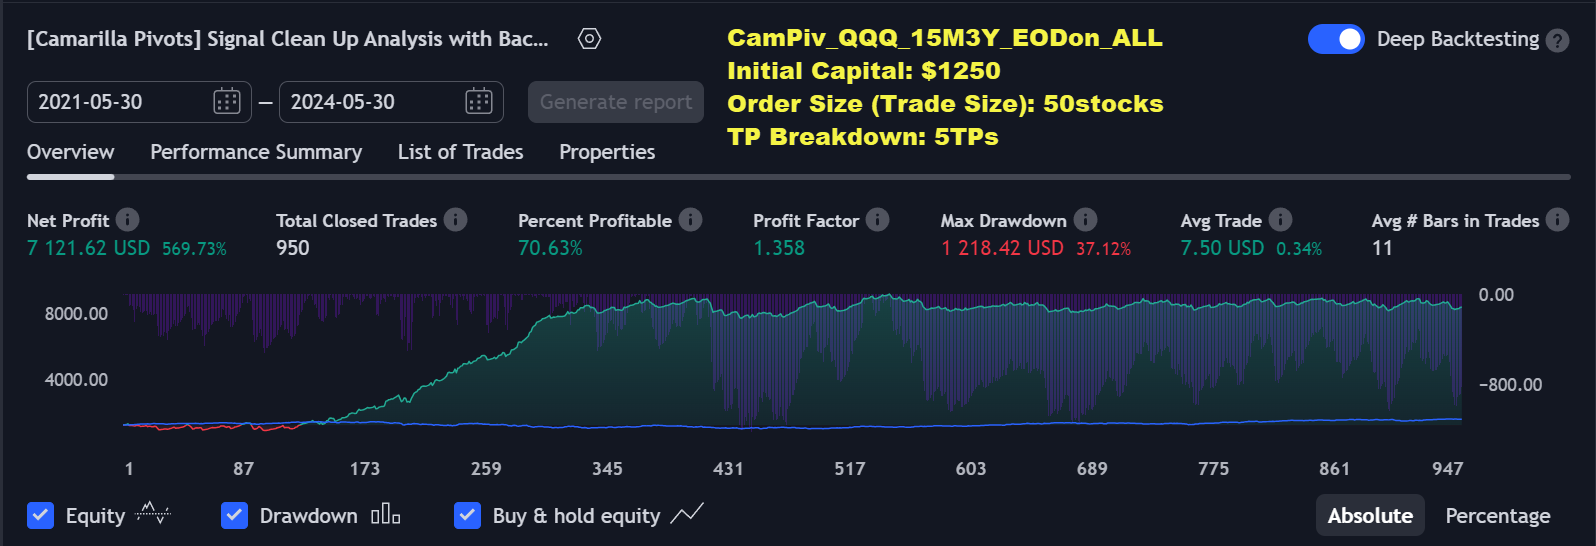
|
||||||||||
|
Crypto(BTCUSD, ETHBTC, LTCUSD, etc.)
|
||||||||||
338% profit in 3 years 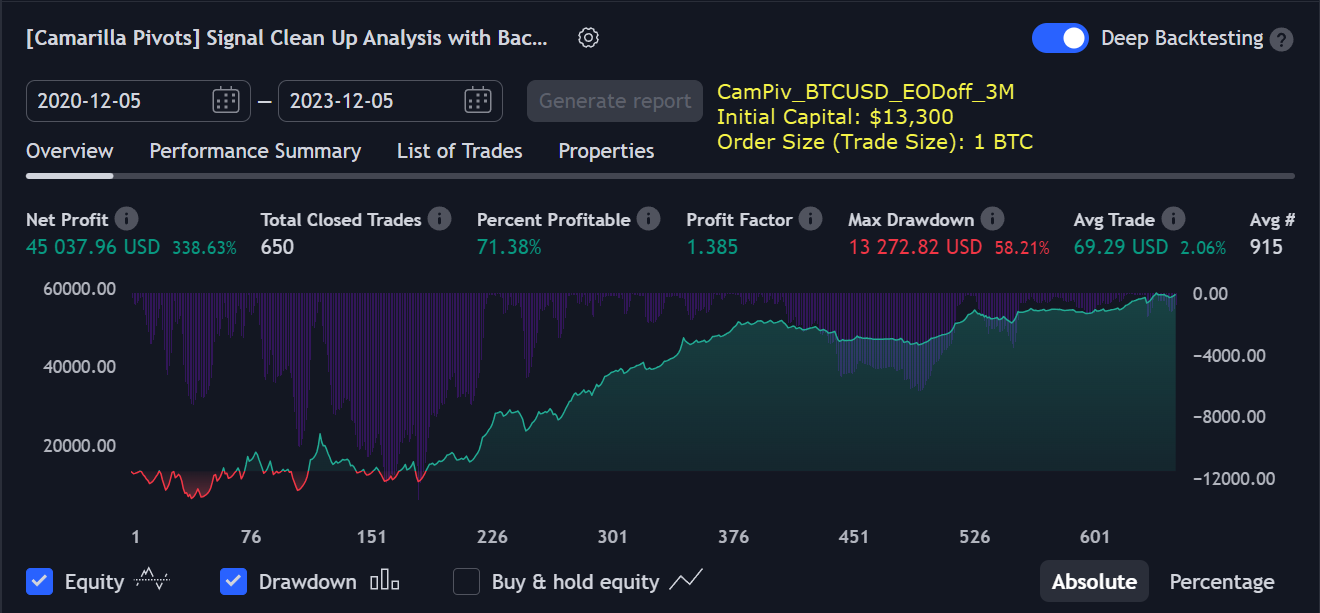
|
||||||||||
317% profit in 3 years 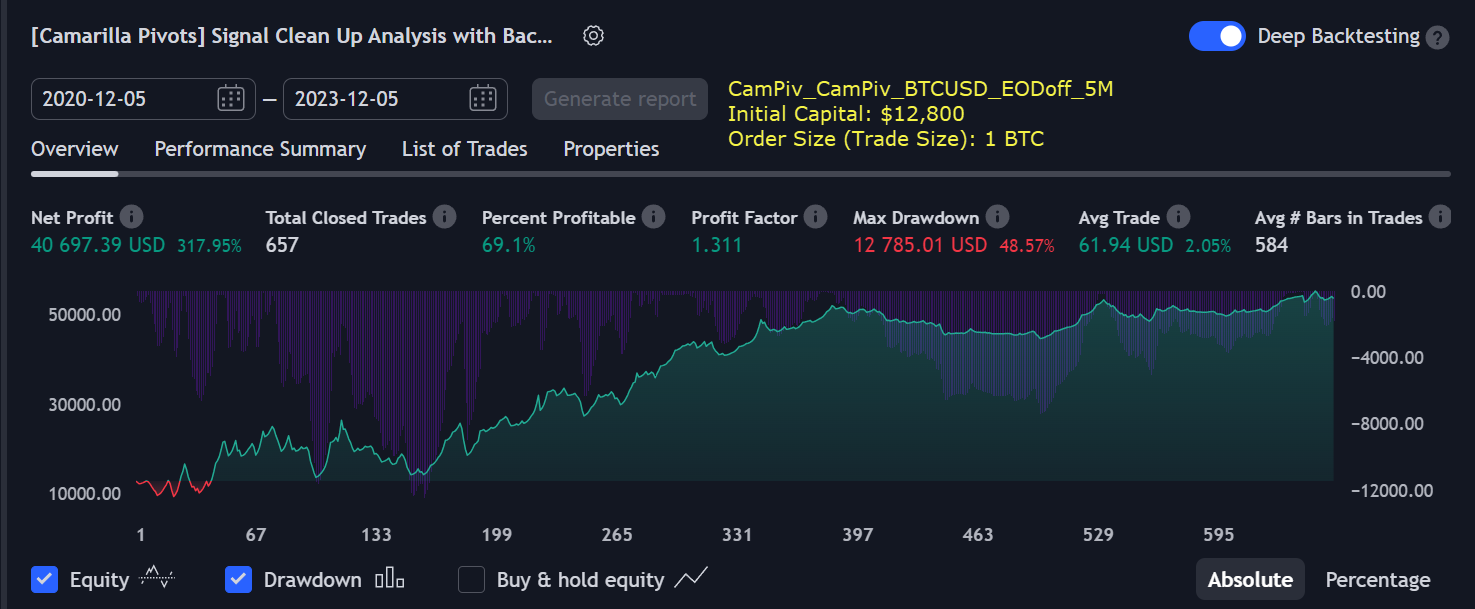
|
||||||||||
|
Futures(Crypto/Indices/Commodities)
|
||||||||||
980% profit in 3 years 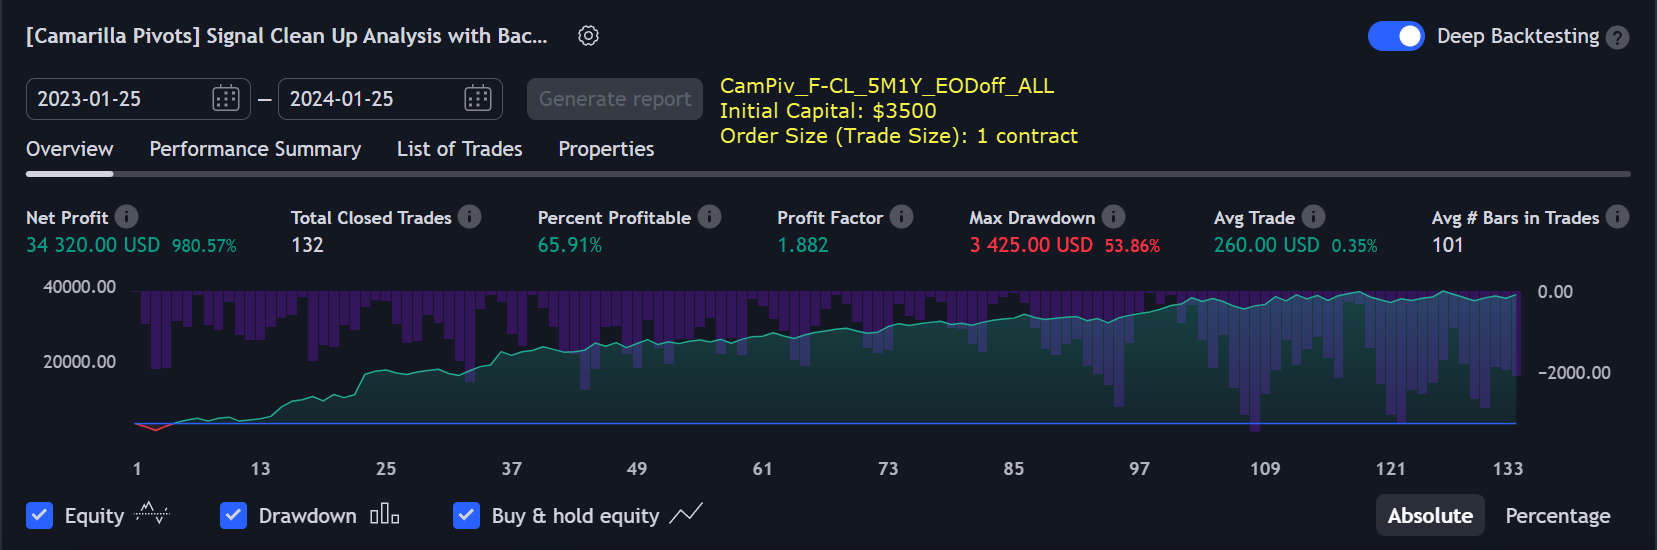
|
||||||||||
530% profit in 3 years 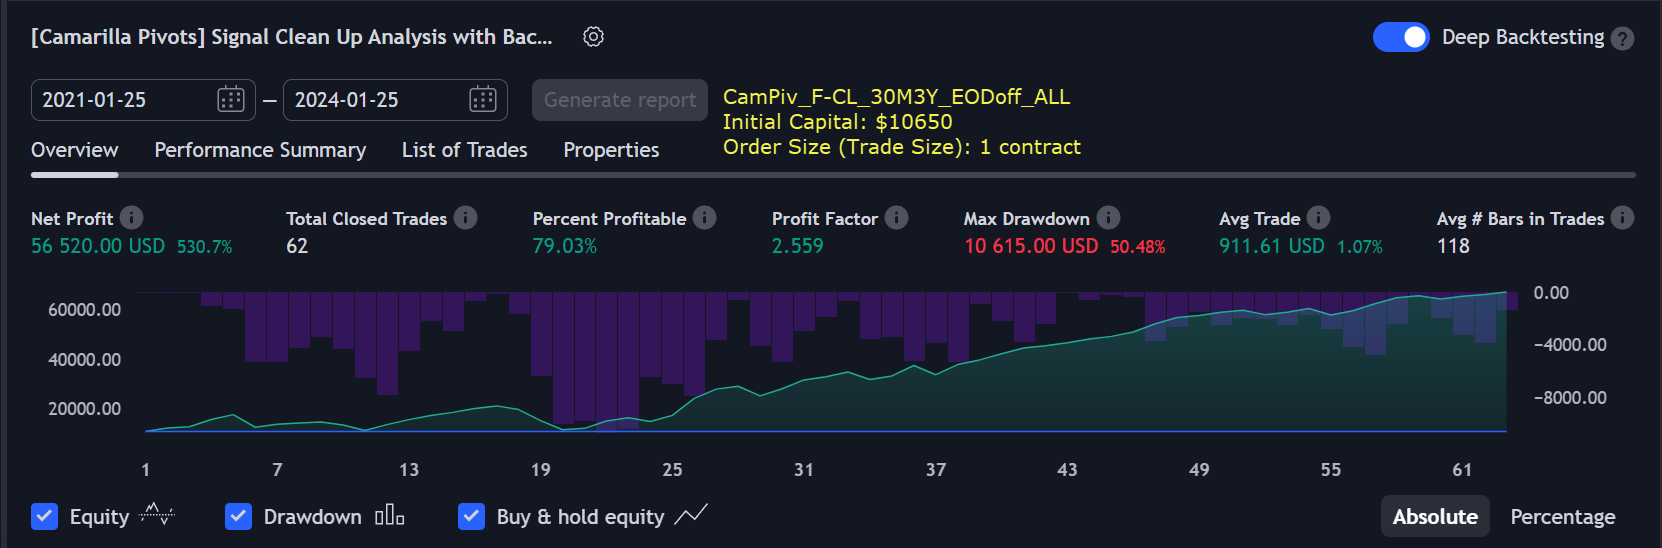
|
||||||||||
351% profit in 1 year 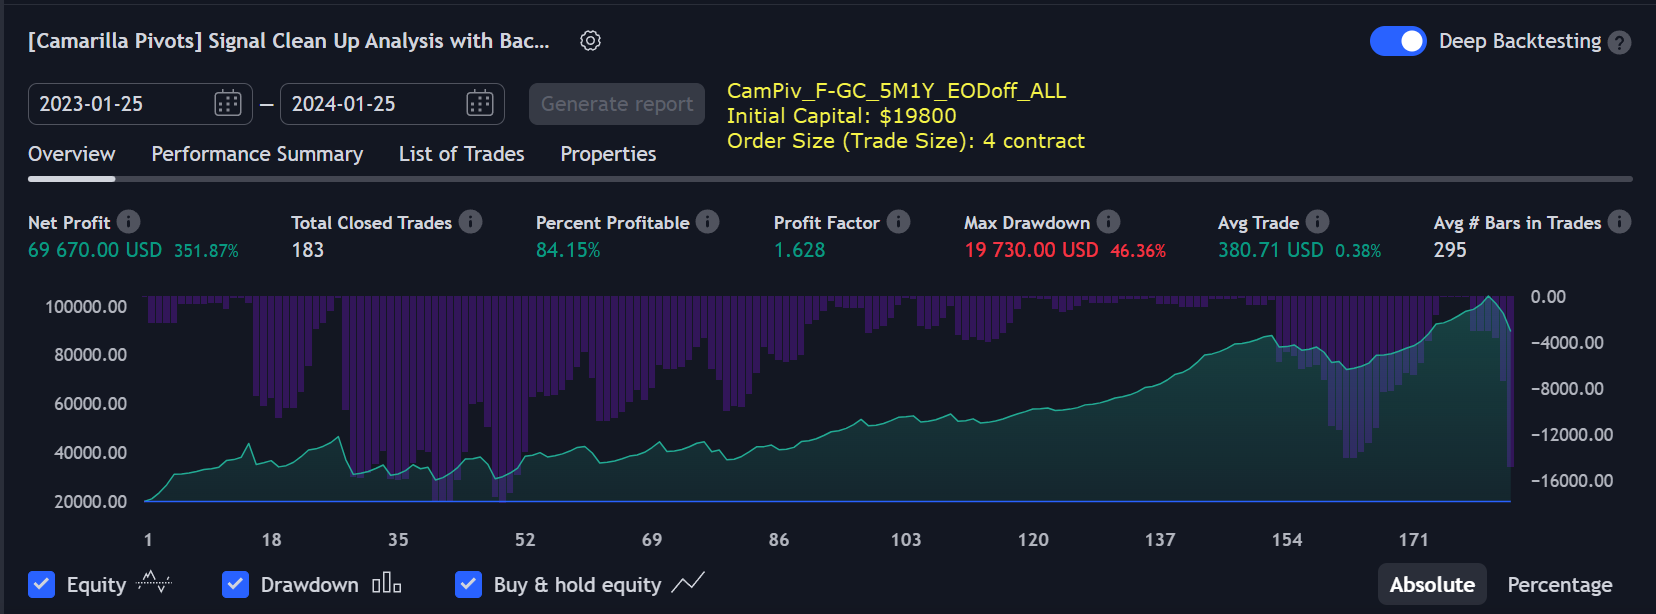
|
||||||||||
785% profit in 3 years 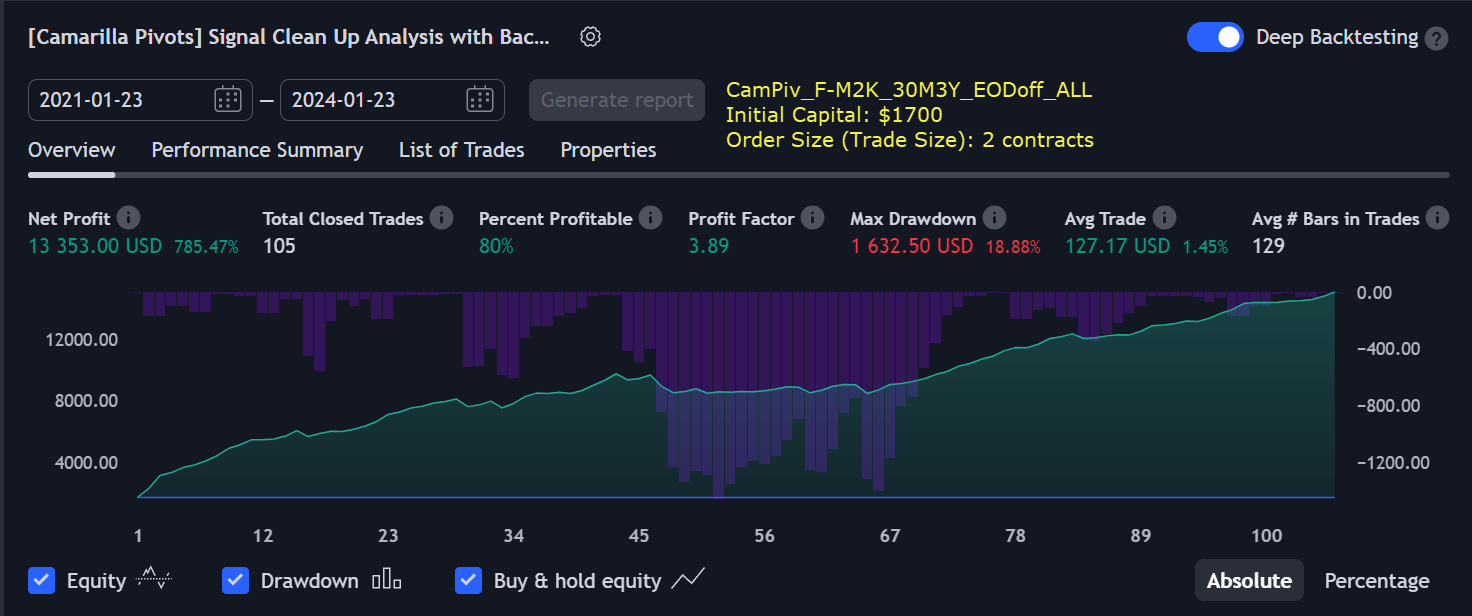
|
||||||||||
694% profit in 3 years 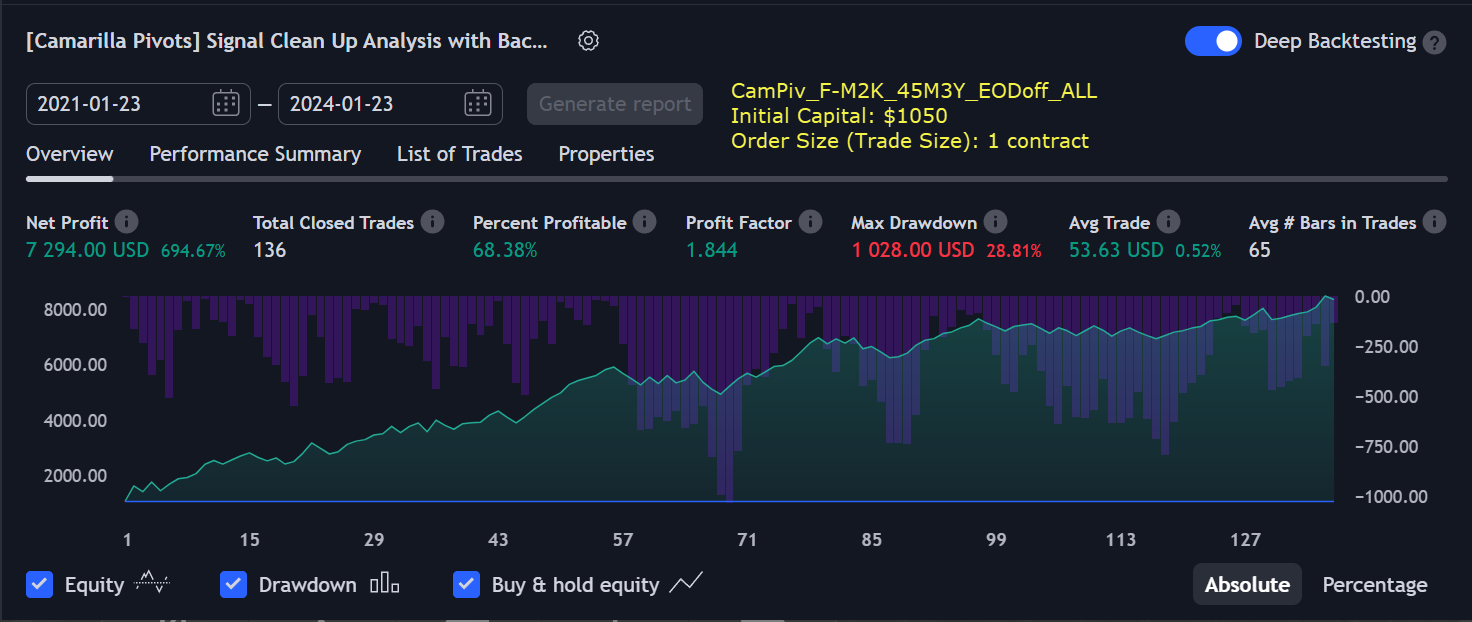
|
||||||||||
880% profit in 1 year 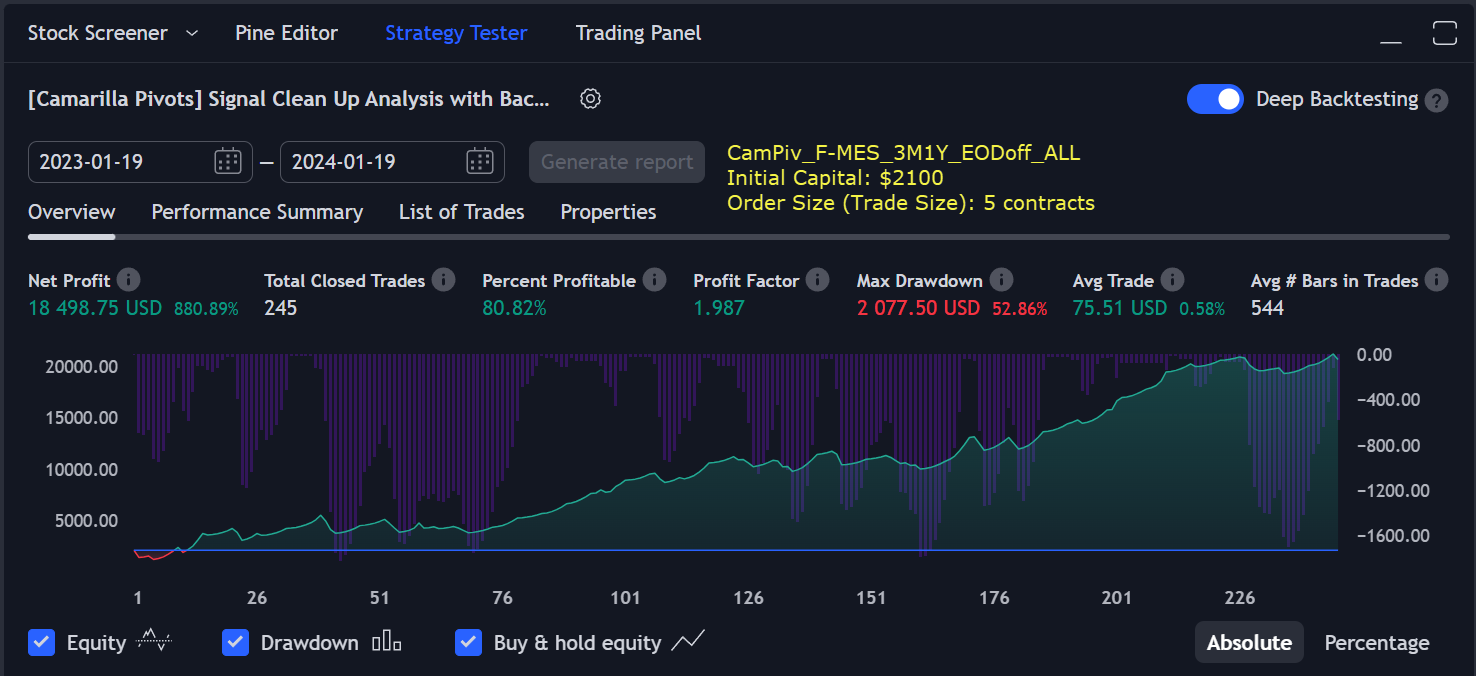
|
||||||||||
788% profit in 1 year 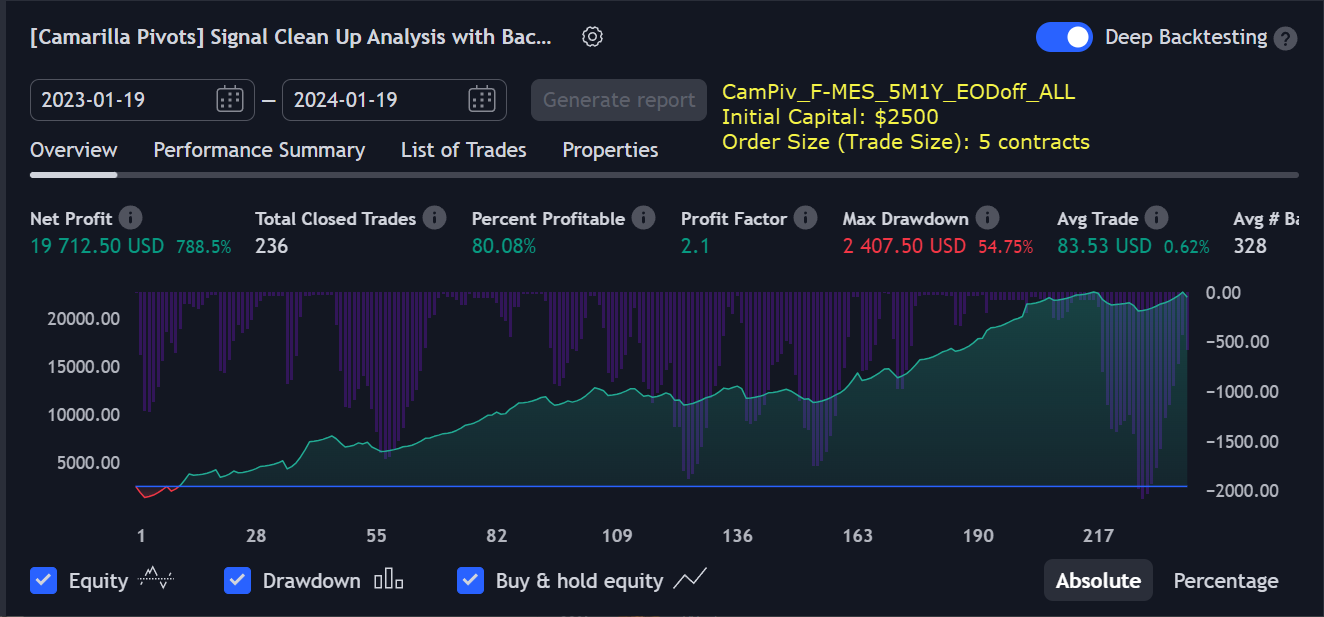
|
||||||||||
1304% profit in 1 year 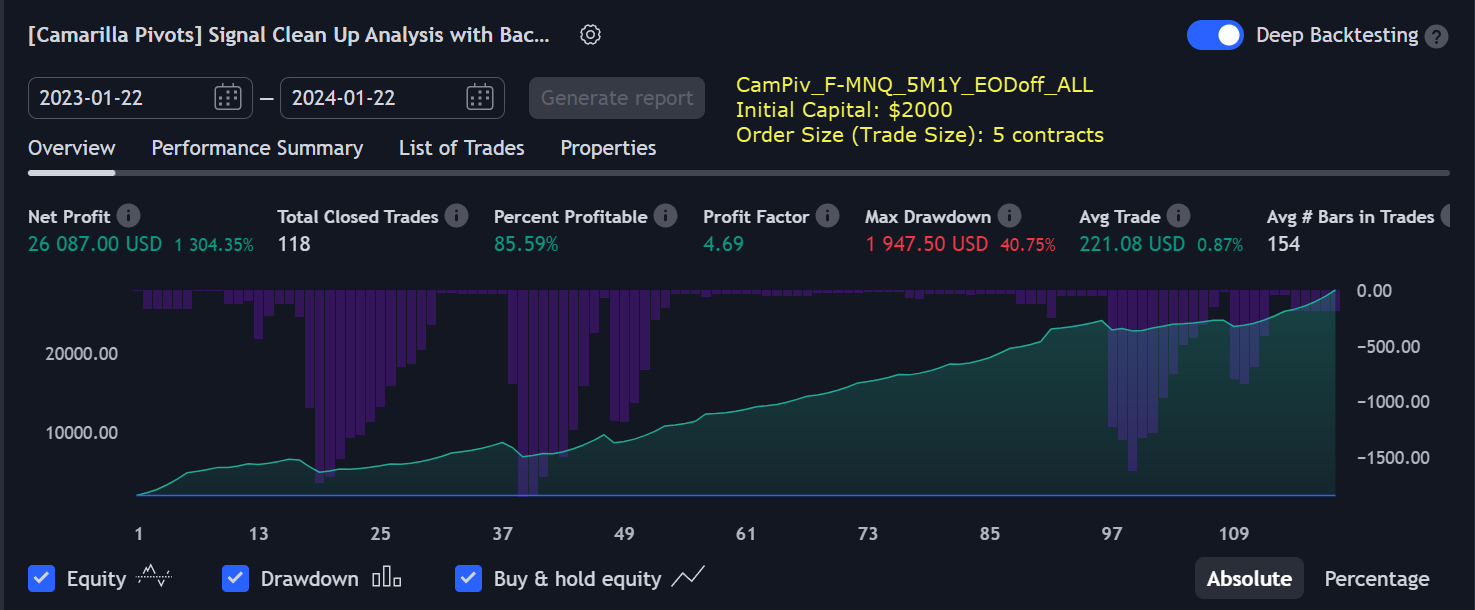
|
||||||||||
1265% profit in 3 years 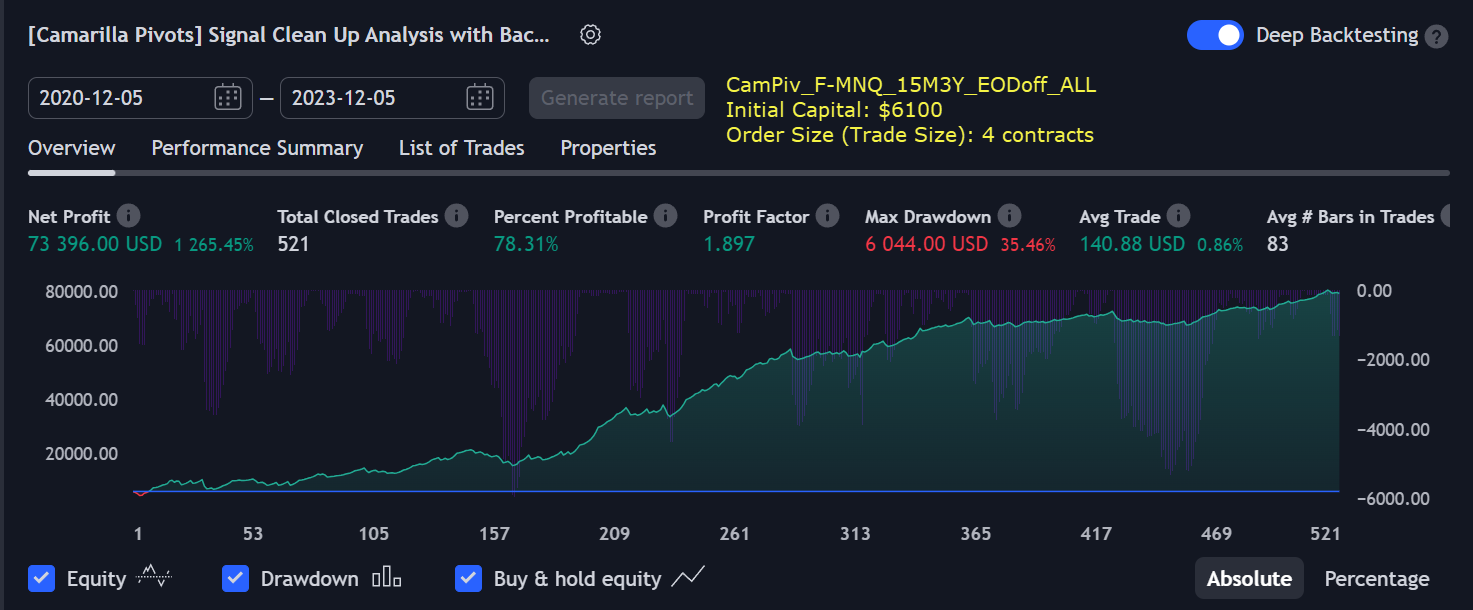
|
||||||||||
2170% profit in 3 years 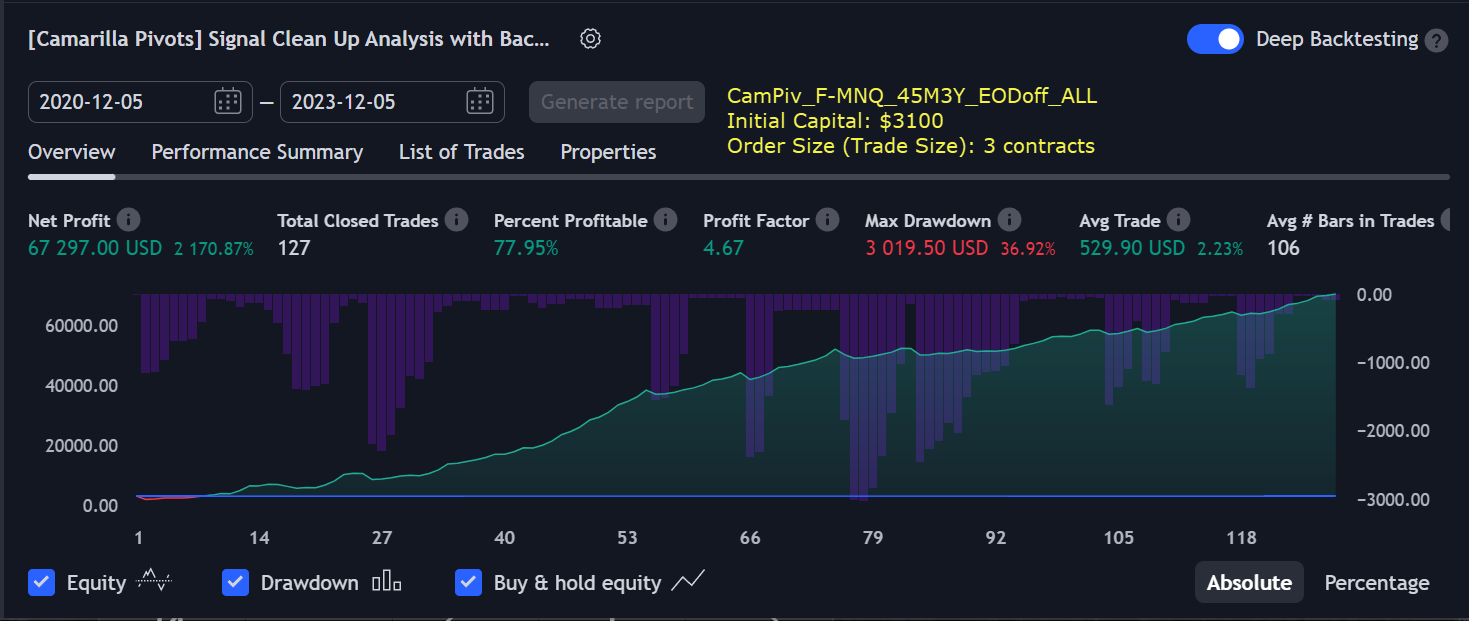
|
||||||||||
737% profit in 3 years 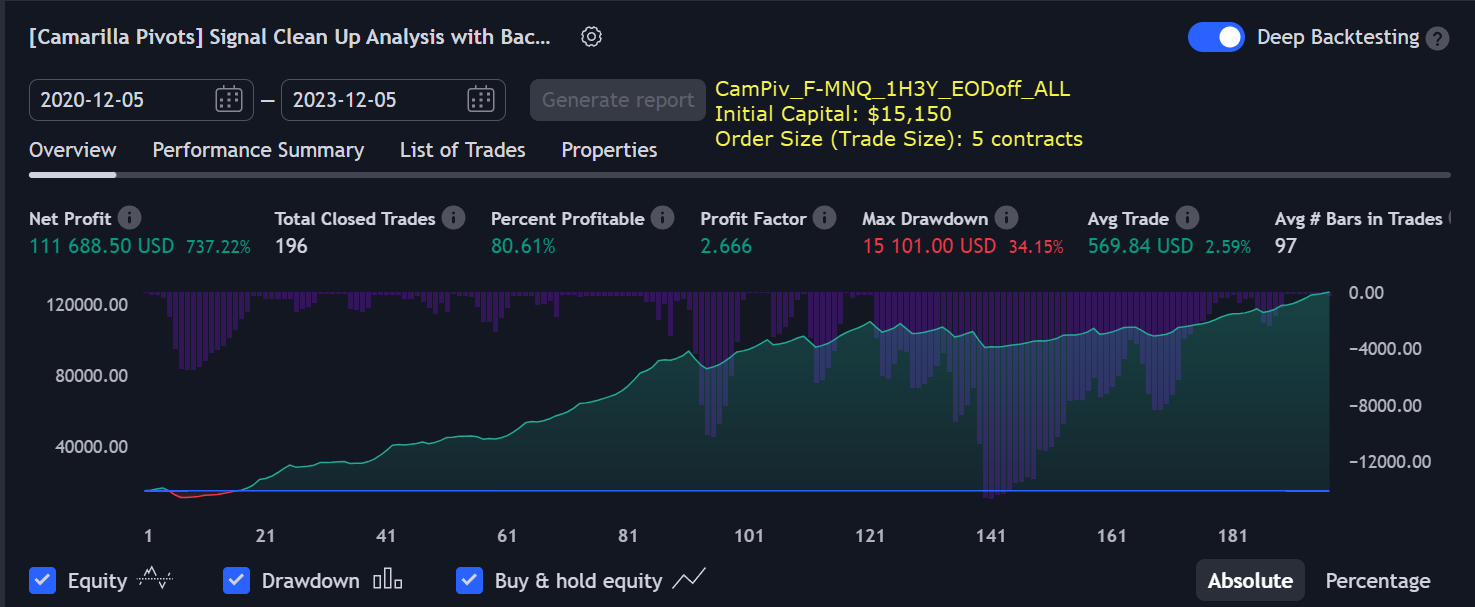
|
||||||||||
|
FOREX (Currencies)
|
||||||||||
285% profit in 5 years 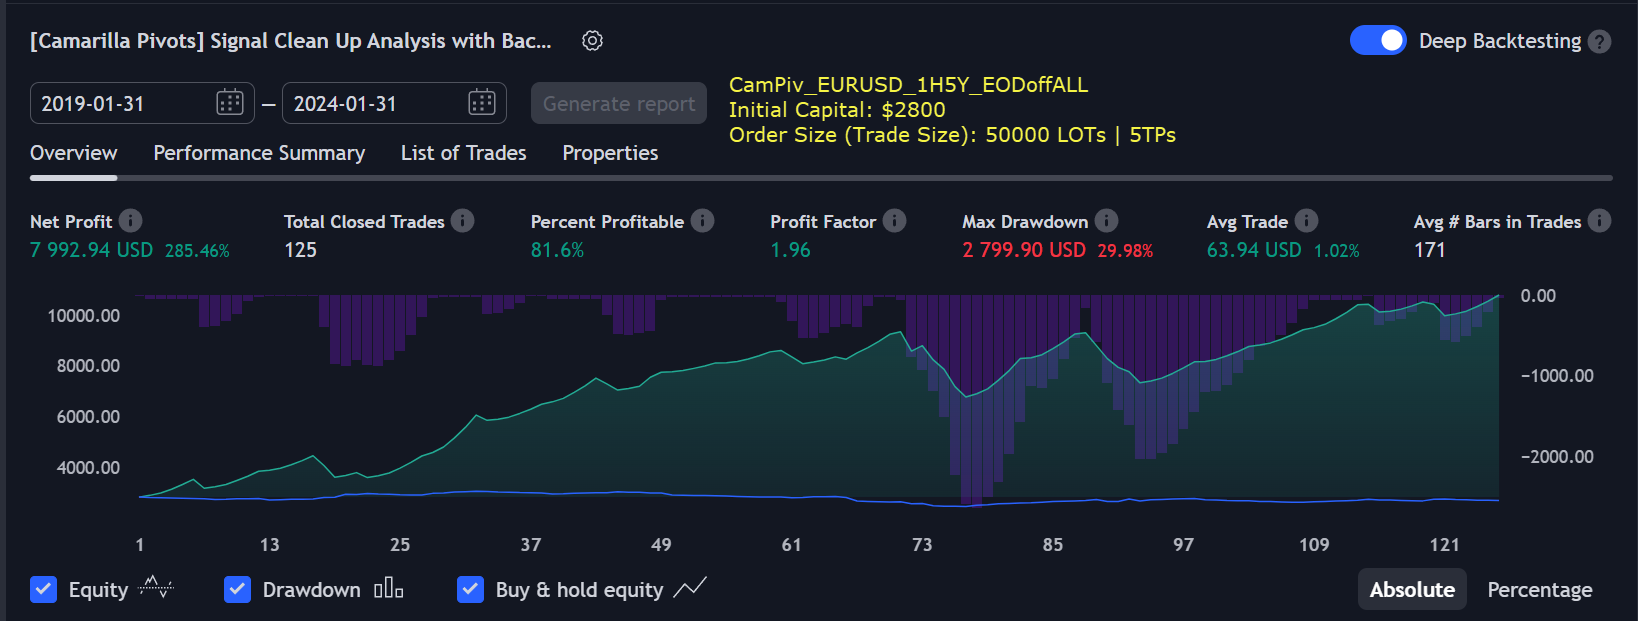
|
||||||||||
586% profit in 5 years 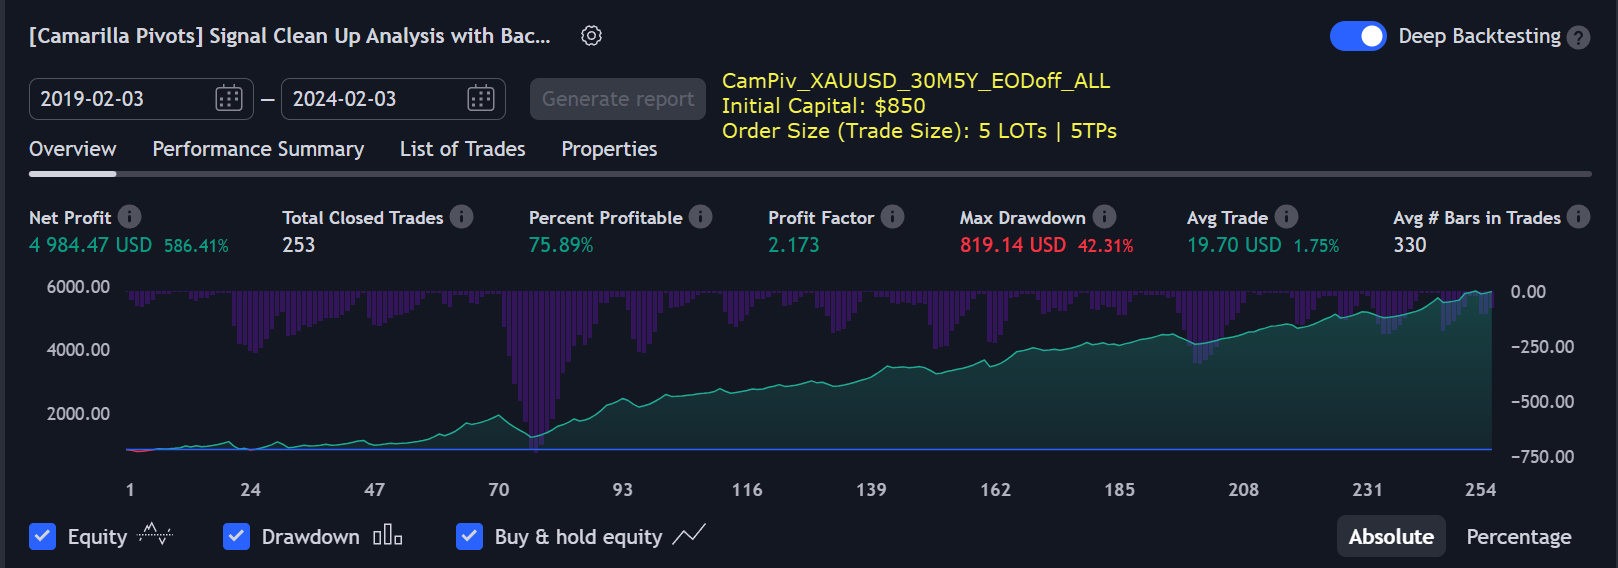
|
||||||||||
733% profit in 5 years 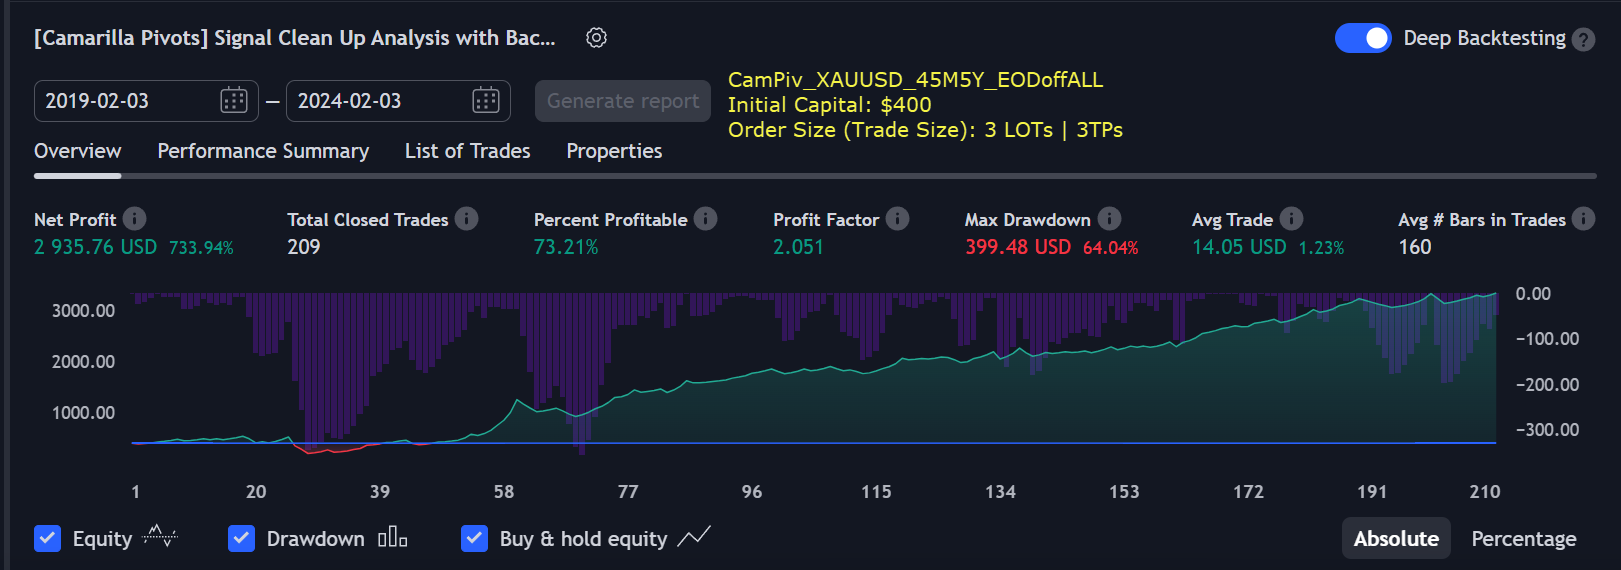
|
||||||||||
1625% profit in 5 years 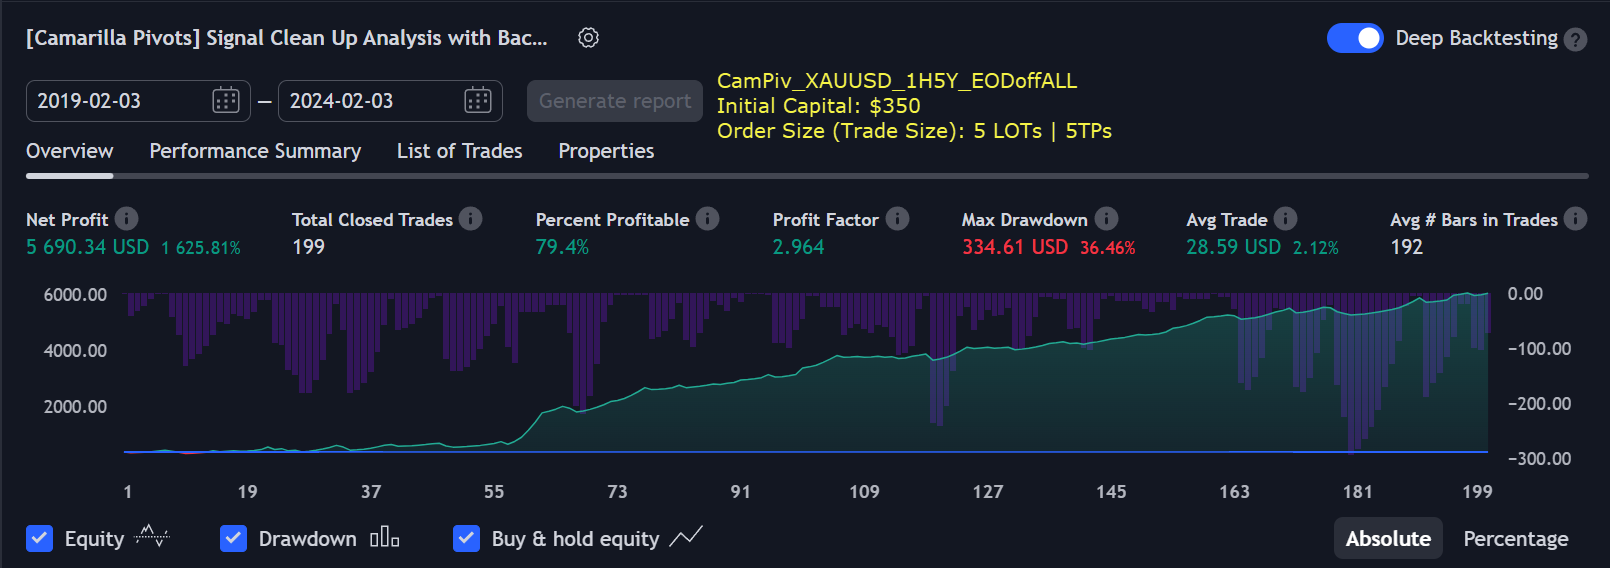
|
||||||||||
|
Shares/Stocks (Indices/Commodities/Companies)
|
||||||||||
455% profit in 5 years 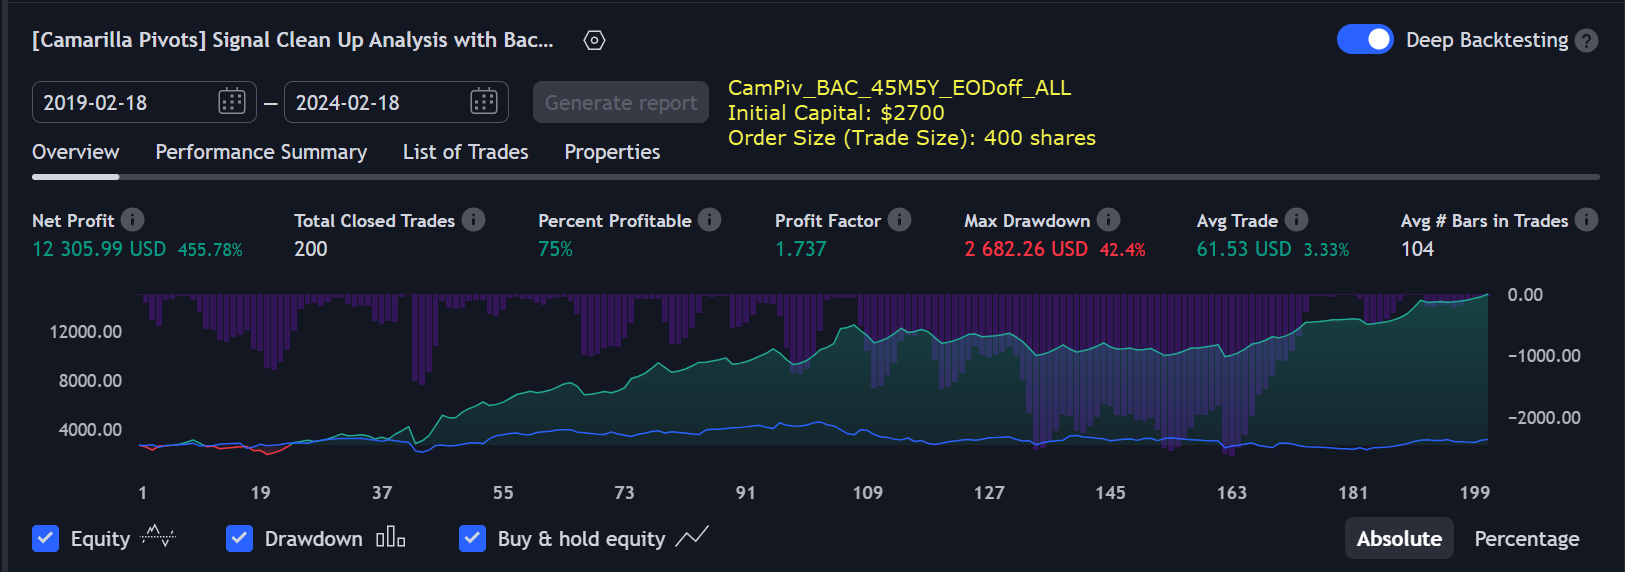
|
||||||||||
696% profit in 3 years 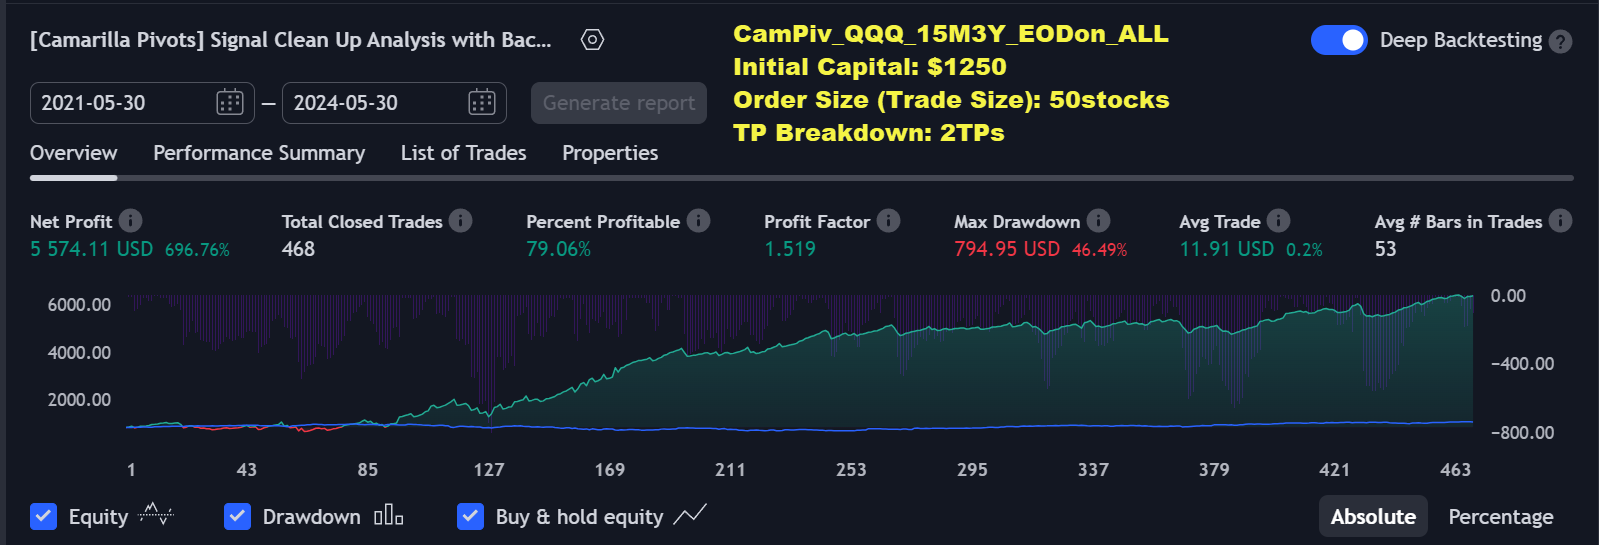
|
||||||||||
1222% profit in 5 years 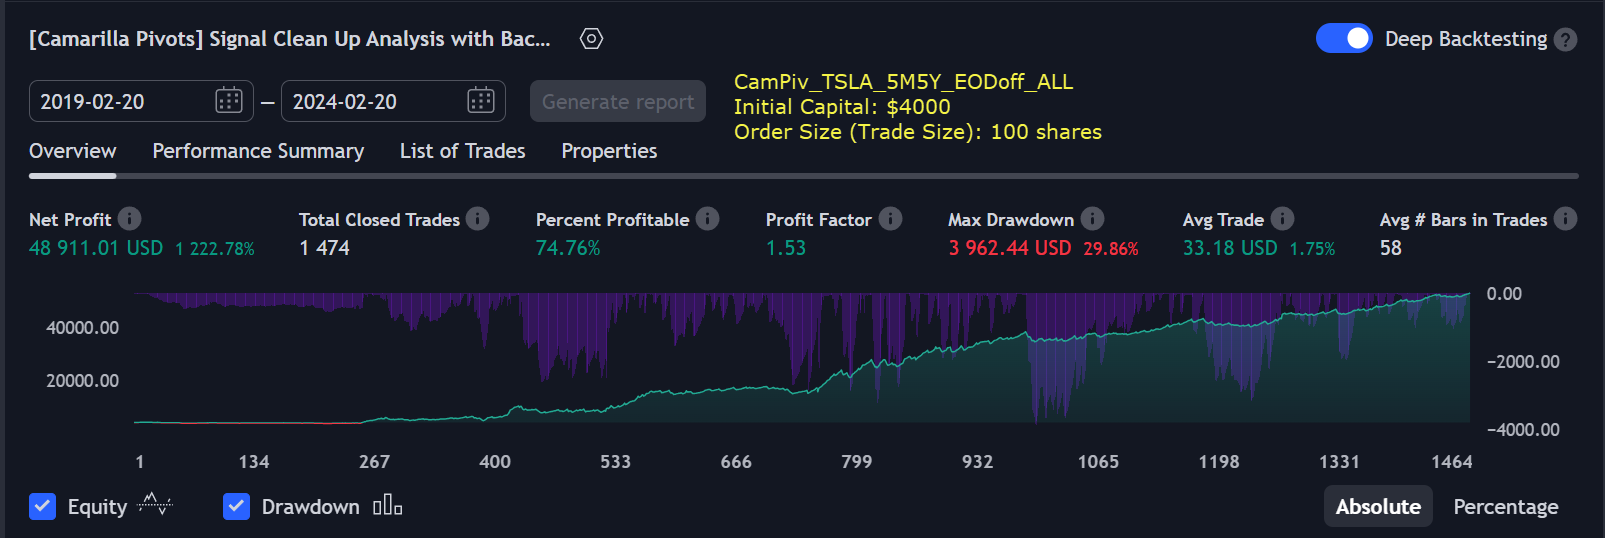
|
||||||||||
779% profit in 5 years 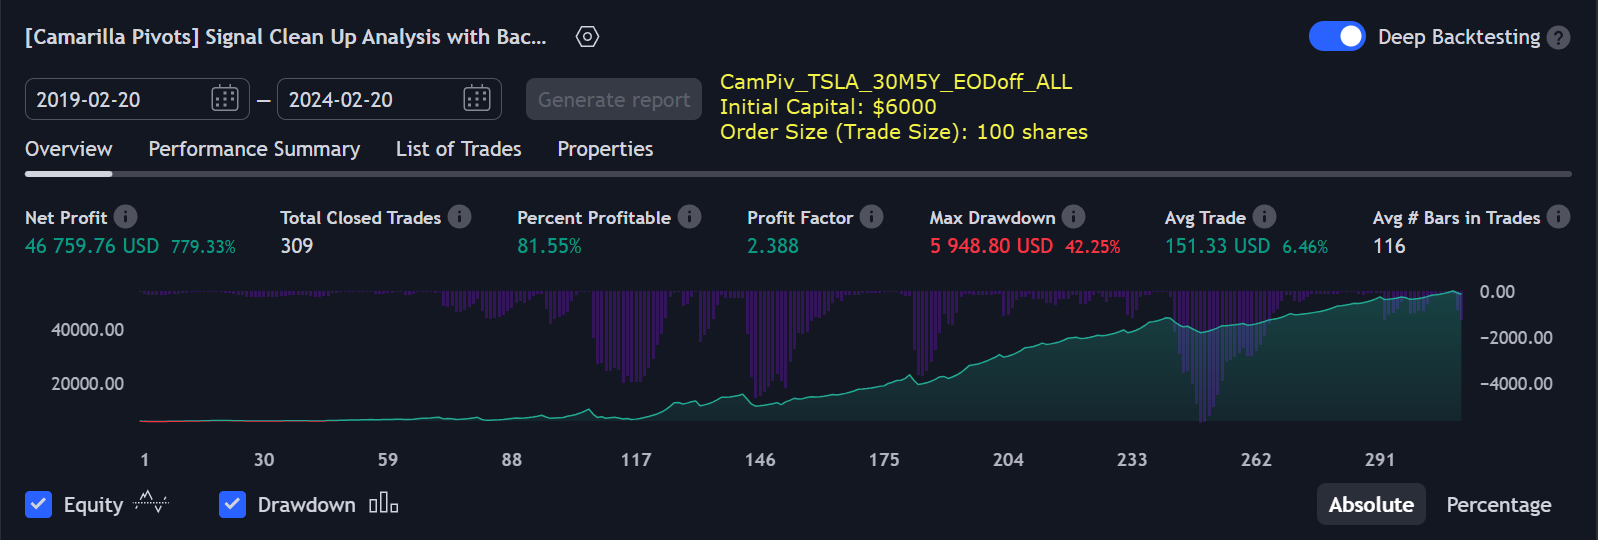
|
||||||||||
737% profit in 5 years 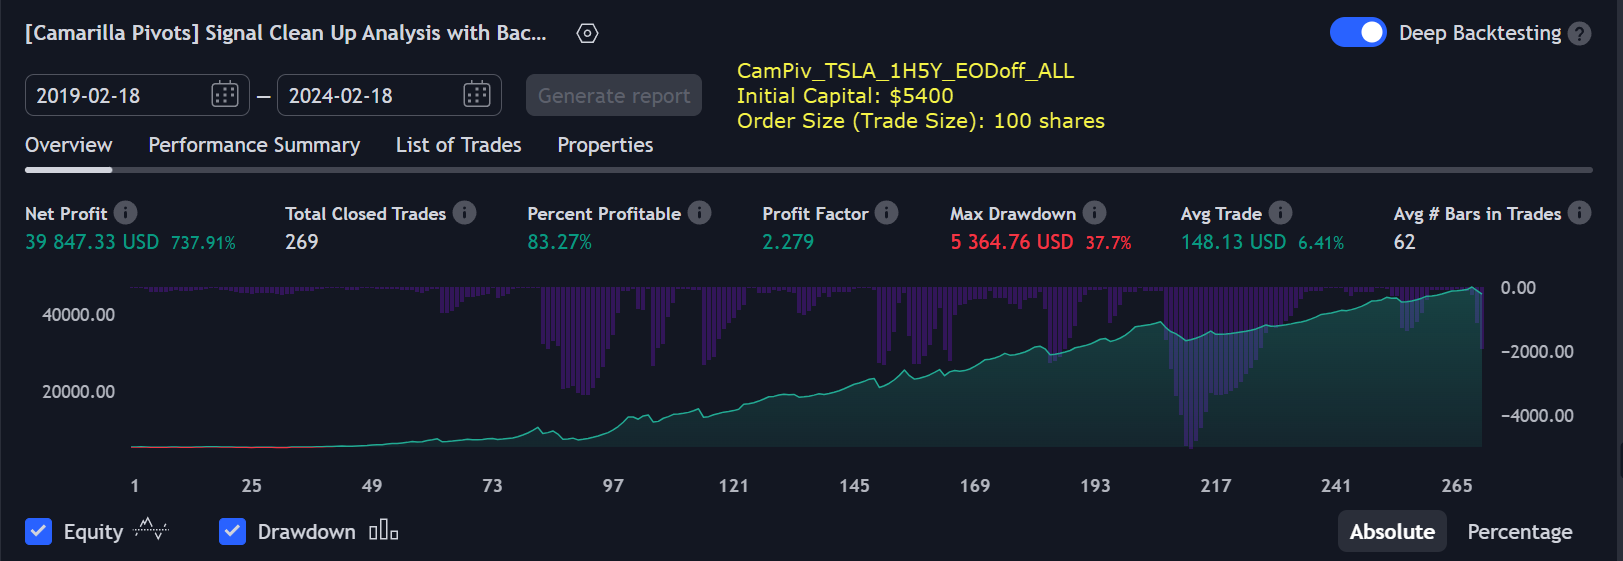
|
||||||||||
Technical Info
![]() Instructions
Instructions ![]() How-to
How-to
(Click or Tap to expand)
- Customizable Backtesting for a specific date range, results via TradingView strategy, which includes “Deep Backtesting” for largest amounts of data on trading results.
- Trading Schedule with customizable trading daily time range, automatic closing/alert trades before Power Hour or right before market closes or leave it open until next day.
- Multiple Signal SOURCEs for opening trades, either SOURCE can be used or both at the same time!
- Static/Dynamic/Trailing Stop-Loss setups (Stop-Loss will be moved to Entry after TP1 is taken, which minimizes risk).
- Single or Multiple profit targets (up to 5).
- Take-Profit customizable offset feature (set Take-Profit targets slightly before everyone is expecting it!).
- Candle bar signal analysis (matching candle color, skip opposite structured and/or doji candle uncertain signals).
- Additional analysis of VWAP/EMA/ATR/EWO (Elliot Wave Oscillator)/Divergence MACD+RSI/Volume signal confirmation (clean chart with indicator showing only the best potential signals!).
- Advanced Alerts setup, which can be potentially setup with a trading bot over TradingView Webhook (NOTE: This will require advanced programming knowledge).
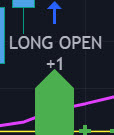
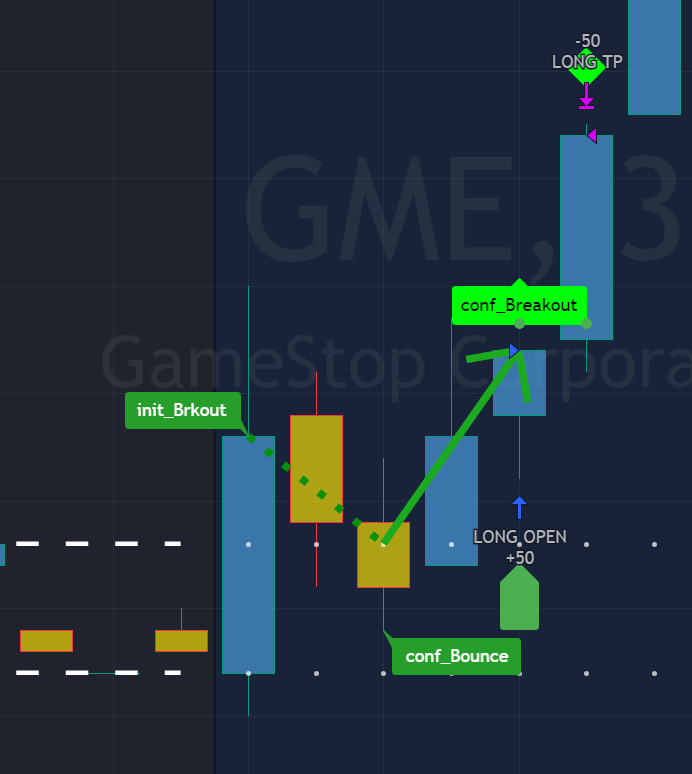
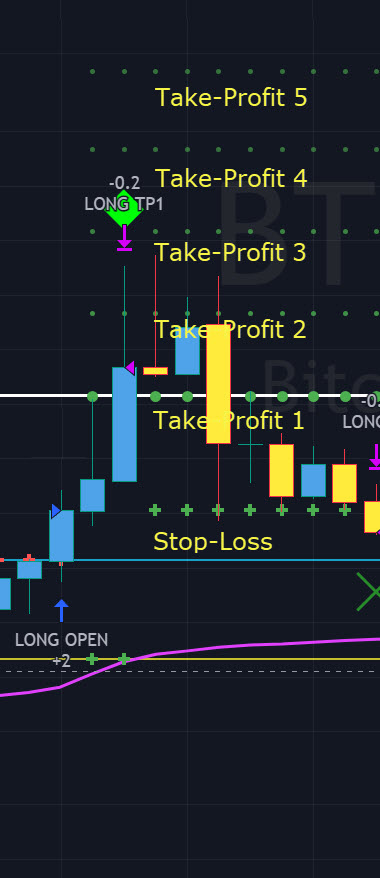
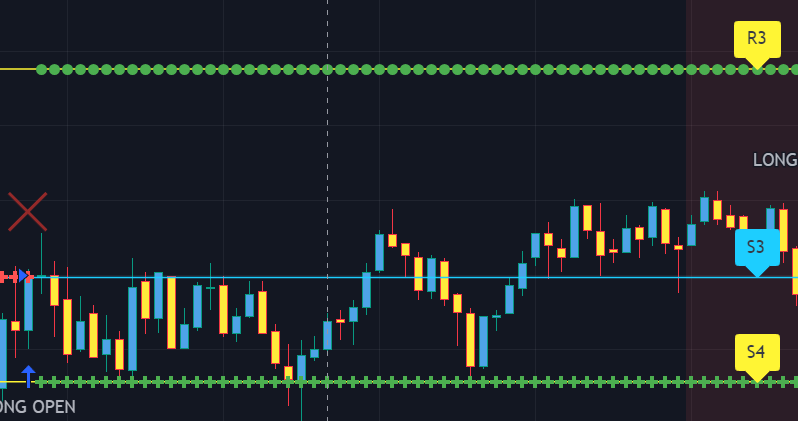
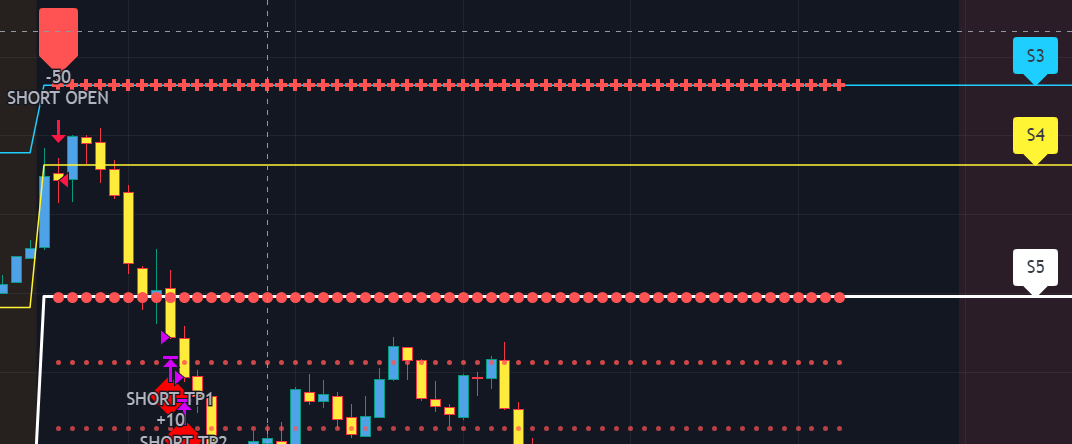
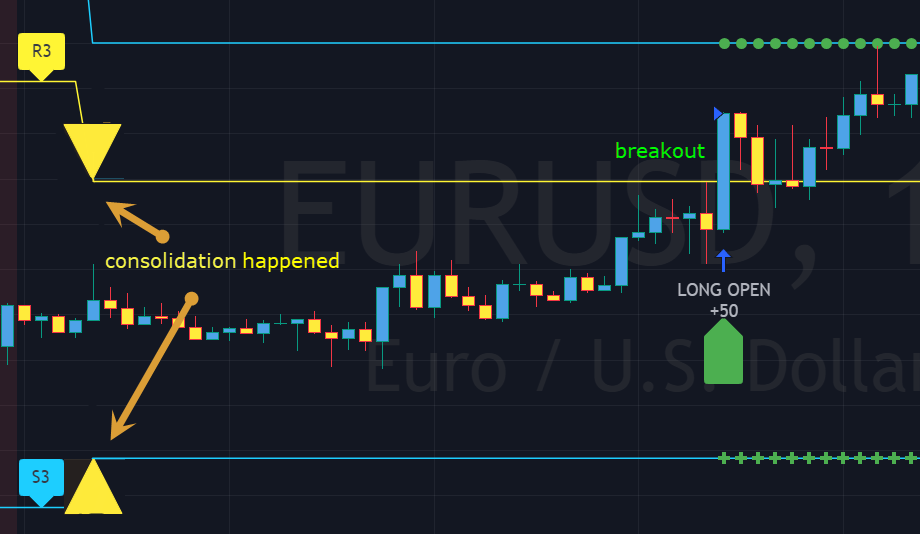
- LONG (↑) open: green "house" looking arrow below candle bar.
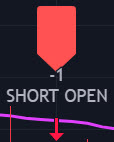
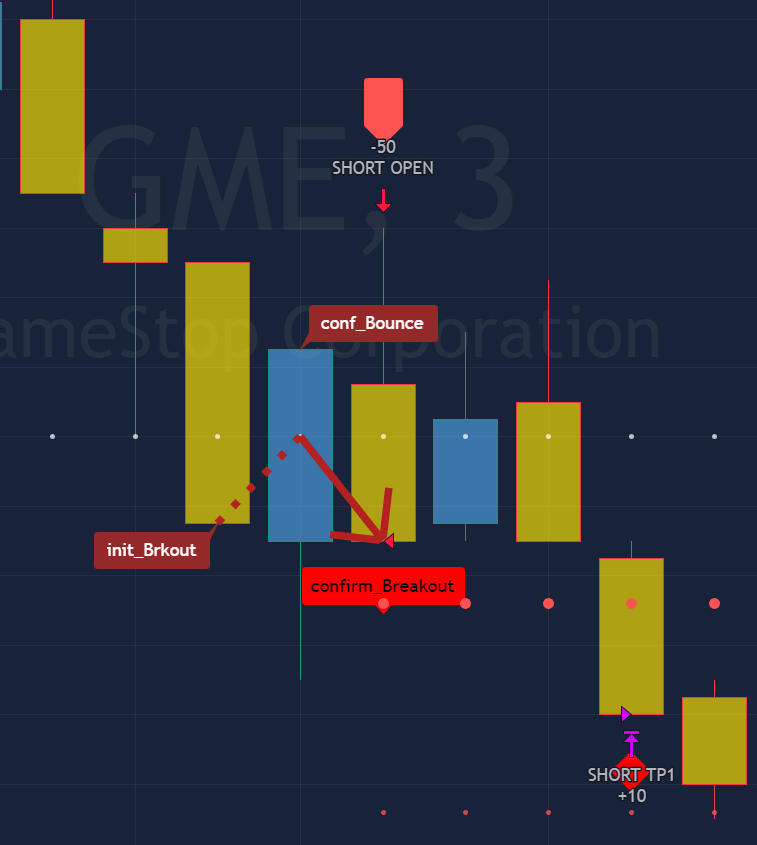
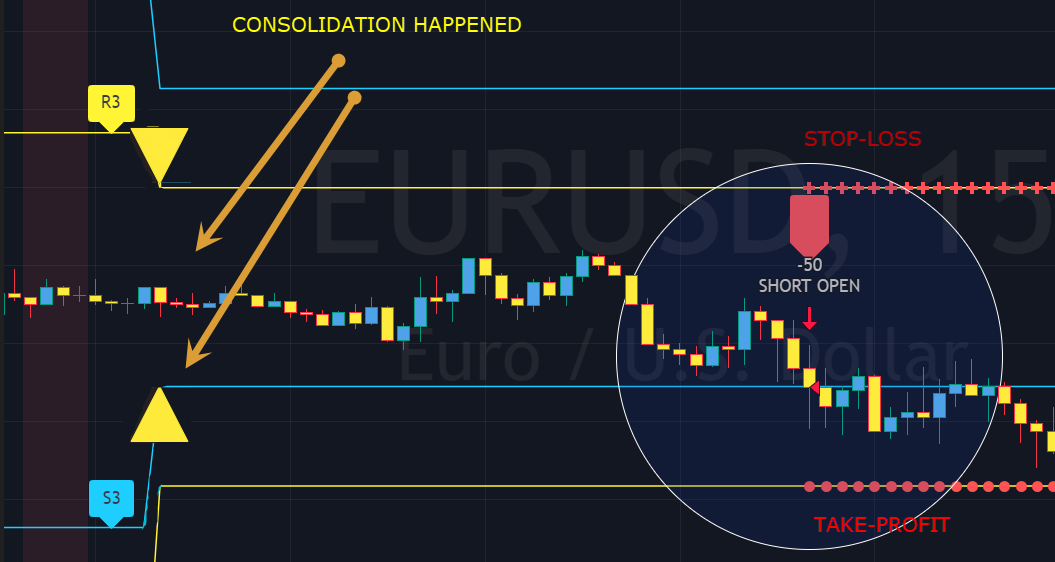
- SHORT (↓) open: red "house" looking arrow above candle bar.
- Smart Breakout: 1) Initial Breakout: "init_Brekout" | 2) Confirmation Bounce: "conf_Bounce" | 3) Confirmation Breakout: "conf_Breakout" (additional labels on chart can be hidden with only Confirmation Breakout shown). .
- LONG/SHORT take-profit target: green/red circles (multi-profit > TP2/3/4/5 smaller circles).
- LONG/SHORT stop-loss target: green/red + crosses.
- LONG/SHORT take-profit hits: green/red diamonds.
- LONG/SHORT stop-loss hits: green/red X-crosses.
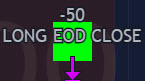
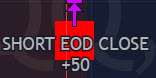
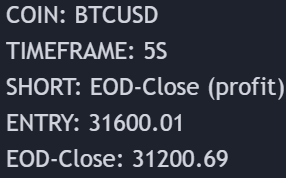
- LONG/SHORT EOD (End of Day | Intraday style) close (profitable trade): green/red squares.
- LONG/SHORT EOD (End of Day | Intraday style) close (loss trade): green/red PLUS(+)-crosses.


-
STATS TABLE
>>> Trading STATS table on the chart showing current trade direction, Last TP (Take-Profit) Taken, Current Trade PL (profit/loss in price difference from trade open to the very current state). -
CUSTOM TRADING DATE RANGE
>>> This feature can be used to manually set indicator trading range from and to a specific date and time. NOTE: This is not intended for a very long date range backtesting, utilize TradingView Strategy Tester for that.
* Use TradingView “Strategy Tester” to see Backtesting results
NOTE: If Strategy Tester does not show any results with Date Ranged fully unchecked, there may be an issue where a script opens a trade, but there is not enough TradingView power to set the Take-Profit and Stop-Loss and somehow an open trade gets stuck and never closes, so there are “no trades present”. In such case - manually check “Start”/“End” dates or use “Deep Backtesting” feature! -
INTRADAY ACTIVE TRADING SESSION CONFIGURATION
>>> Regional Active Trading Session Hours Schedule: If selected - trades will only open during regional active trading session, if 'OFF', there will be no trading schedule and trades will open 24/7.
Below 2 settings are only for "CUSTOM" "Regional Active Trading Session Hours Schedule":
>>>>> CUSTOM - Active Trading Session Hours Schedule (Local/TradingView Time Zone): Time selected below will be in Local/TradingView Time Zone | NOTE: Be careful with CUSTOM setting as it may allow the indicator to trade during per/after market and open trades after EOD (End of Day) hour if incorrect times are input!
>>>>> CUSTOM - EOD(End of Day) Close - Hour
>>> EOD(End of Day) Close - On/Off: Close the trade if it's still open at the end of active trading session (on the very last candle bar). NOTE: If 'Regional Active Trading Session Schedule' will be set to "OFF": there will be no EOD(End of Day) Close and trades will run overnight until either SL(Stop-Loss) or TP(Take-Profit) is hit!
>>>>> EOD(End of Day) Close - 1 candle bar before last: This is specifically for stocks as while usually indices can be closed 15minutes after the market closes, for stocks - the last candle bar closes at the same time with the market active trading session, which if closed - trades can't be closed until next day/session! Enable this setting for the trade to close/alert 1 candle bar before the last one, so there is still time to close the trade at the Broker (NOTE: depending on the timeframe, 1 candle bar can be: 15sec, 30sec, 1min, 3min, 5min, 15min, 30min, 45min, 1h).
Here is a table of all the included regional trading session hours. Region Local Time EST Time US/Canada NY_withPW(EDT) 09:30-16:00 09:30-16:00 NY_noPW(EDT) 09:30-15:00 09:30-15:00 Toronto(EDT) 09:30-16:00 09:30-16:00 Europe Amsterdam(CEST) 09:00-17:30 02:00-10:30 Frankfurt(CEST) 09:00-17:30 02:00-10:30 London(BST) 08:00-16:30 02:00-10:30 Stockholm(CEST) 09:00-17:25 02:00-10:25 Zurich(CEST) 09:00-17:20 02:00-10:20 Eurasia (CST > China Standard Time) Hong Kong(HKT) 09:30-16:00 20:30-03:00 Mumbai(IST) 09:15-15:30 22:45-05:00 Shanghai(CST) 09:30-15:00 20:30-02:00 Shenzhen(CST) 09:30-14:57 20:30-01:57 Riyadh(AST) 10:00-15:00 09:00-14:00 Seoul(KST) 09:00-15:30 19:00-01:30 Taiwan(CST) 09:15-13:30 20:15-00:30 Tokyo(JST) 09:00-15:00 19:00-01:00 Australia Sydney(AEDT) 10:00-16:00 18:00-00:00 Brazil Sao Paulo(BRT) 10:00-17:55 08:00-15:55 South Africa Johannesburg(SAST) 09:00-17:00 02:00-10:00 -
TRADE SIGNAL CONFIGURATION
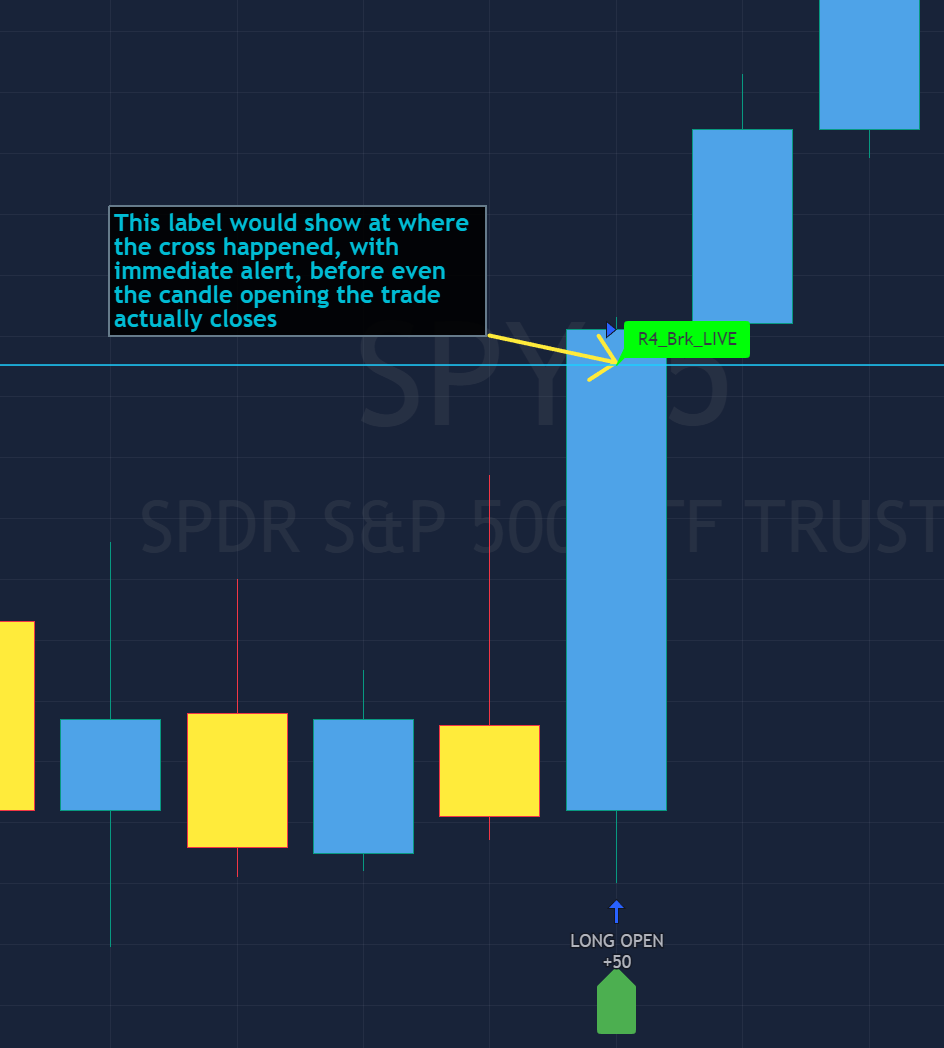
>>> Custom - Potential Trade about to be Open Live Alert/Show - On/Off: An alert will be triggered with label shown on the chart at potential trade about to be open, once price crosses the trade signal level (The whole trading engine/backtesting signals are considered valid only once candle bar closes, while trade open condition is true at the same time). NOTE: It will only trigger if no valid trade is already open. NOTE: This particular feature cannot be backtested and is not included in the backtesting results, so please use with discretion. NOTE: This feature works outside of Signal Analysis and Cleanup scope and simply triggers when potential trade open level is crossed.
>>> Trading Systems: 1) "Open Until Closed by TP or SL": the signal will only open a trade if no trades are currently open/running, a trade can only be closed by Take Profit, Stop Loss or End of Day close (if turned on) | 2) "Open Until Closed by TP or SL + OCA": Same as 1), but if there is an opposite signal to the trade which is currently open > it will immediately be closed with new trade open or End of Day close (if turned on).
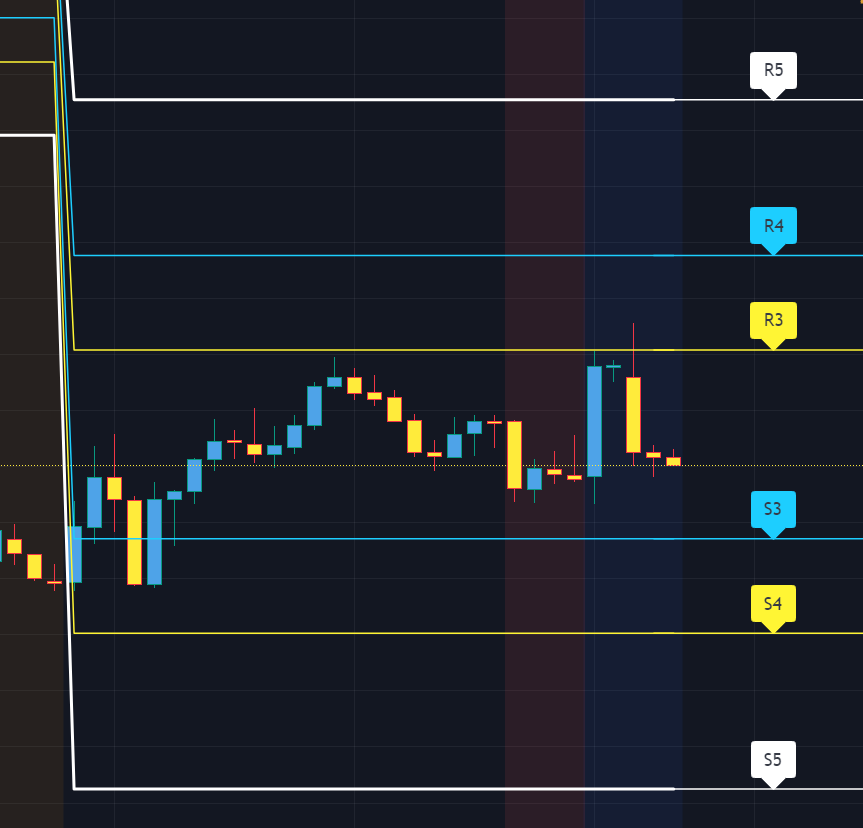
>>> Position Open sources:
- Position Open - SOURCE1 | LONG: S3, SL: S4, TP1: R3, TP2: R4, TP3: R5, TP4/5: Smart Formula | SHORT: R3, SL: R4, TP1: S3, TP2: S4, TP3: S5, TP4/5: Smart Formula
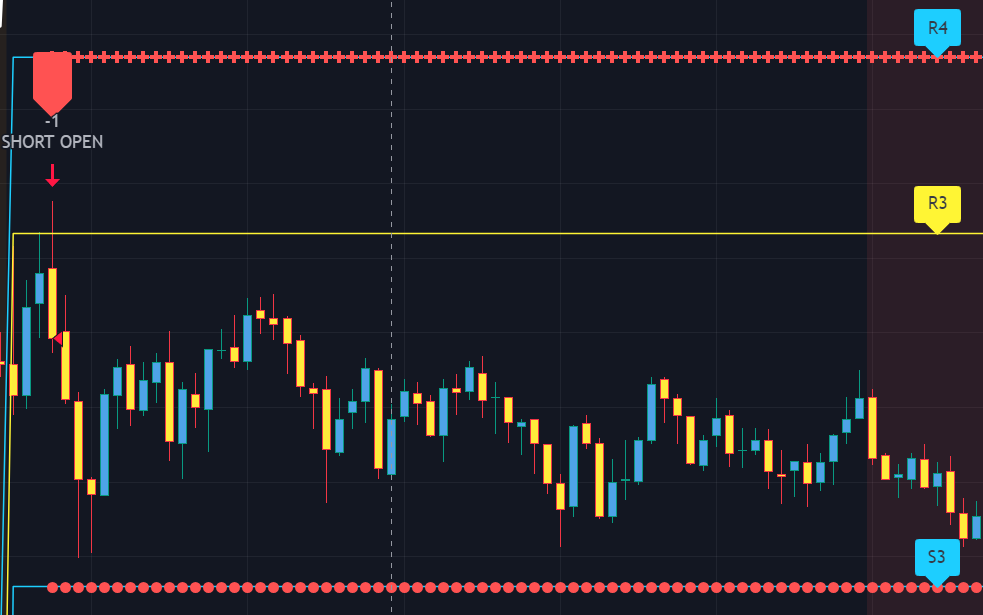
- Position Open - SOURCE2 | LONG: R4, SL: R3, TP1: R5, TP2/3/4/5: Smart Formula | SHORT: S4, SL: S3, TP1: S5, TP2/3/4/5: Smart Formula
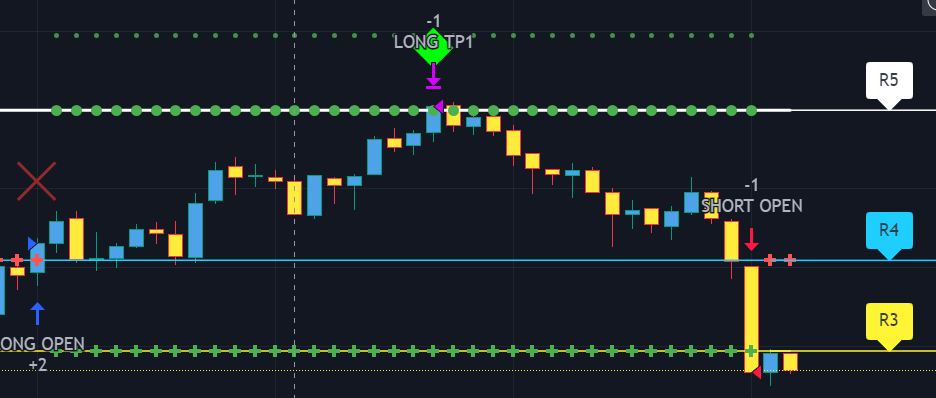
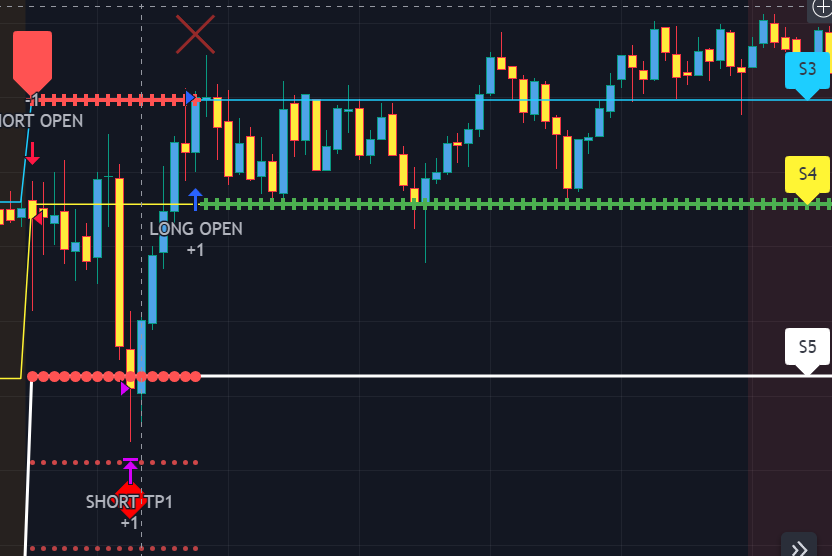
- Position Open - SOURCE3 | LONG: R5, SL: R4, TP1/2/3/4/5: Smart Formula | SHORT: S5, SL: S4, TP1/2/3/4/5: Smart Formula
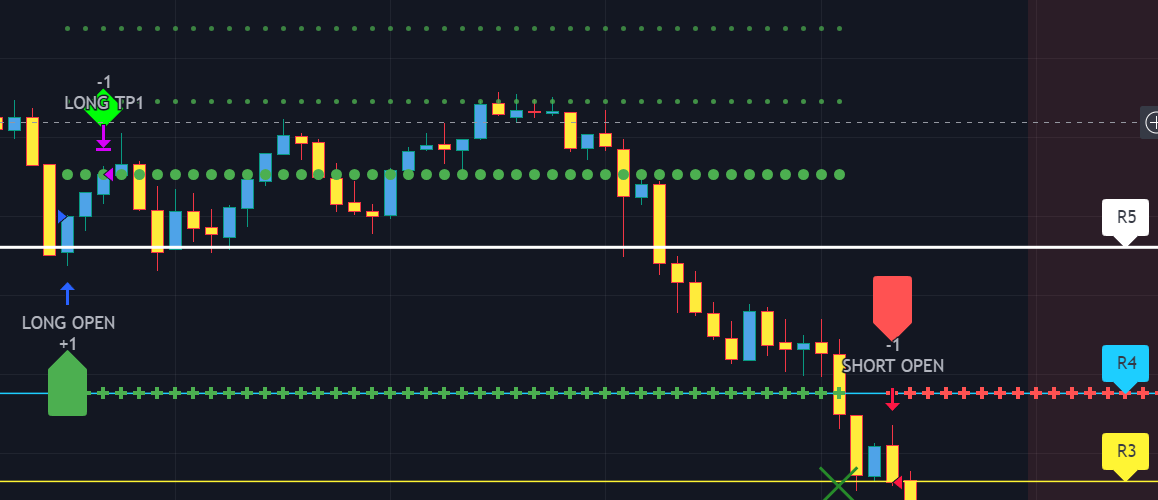
- Position Open - SOURCE4 (R3/S3 consolidation breakout) | LONG: R3, SL: S3, TP1: R4, TP2: R5, TP3/4/5: Smart Formula | SHORT: S3, SL: R3, TP1: S4, TP2: S5, TP3/4/5: Smart Formula
-
TAKE-PROFIT/STOP-LOSS CONFIGURATION
>>> SL (Stop-Loss) - Regular - On/Off: Without SL (Stop-Loss), unless EOD (End of Day) Close or the below Combination with an Opposite Signal Only SL (Stop-Loss) turned on - there will be no SL (Stop-Loss) at all!
>>> SL (Stop-Loss) - Combination with an Opposite Signal Only - On/Off: This unique SL (Stop-Loss) condition will only trigger in combination with an opposite signal at the same time!
>>> Signal Candle Bar consuming Take-Profits: Position/trade signal candle bar is so big that it consumes the first TP setting (If signal open candle bar is big enough it cover the first Take-Profit area > the signal can either be skipped, or all Take-Profit areas pushed ahead from signal candle bar close using smart formula)
>>> TP (Take-Profit) System: Always "Static" due to nature of the indicator
>>> SL (Stop-Loss) System: Static: SL is set at trade open and remains such; Dynamic: Once ANY TP (Take-Profit) is taken > SL (Stop-Loss) will be moved to trade Entry price; Trailing: SL (Stop-Loss) will follow the trade and reduce risk with each taken TP (Take-Profit). At TP1 taken > SL moves to Entry, at TP2 taken > SL moves to TP1, at TP3 taken > SL moves to TP2 and so on.
>>> # of TPs (number of take profit targets): Just like it is named, this is where the number of Take-Profit targets is selected (NOTE: If "OCA (no TP or SL)" Trading System is selected, this setting won’t do anything, since there are no TP or SLs for that system).
>>> TP (Take-Profit) Offset - On/Off: This is a special feature for all Take-Profit targets, where a customizable offset can be turned on, so that if the price is almost hitting the Take-Profit target, but never actually touches it > it can be captured. This is good to use with HHLL (Highest High Lowest Low), which is pretty much a Support/Resistance as often the price will nearly touch these strong areas and turn around…
-
SIGNAL ANALYSIS AND CLEANUP
>>> Signal Cleanup - Bar Color: Include Bar Color (bullish/bearish) confirmation, LONG signal will only be opened if signal bar is green/bullish, SHORT if red/bearish.
>>> Signal Cleanup - Bar Directional Structure: Skip opposite bar structure types signals (For example: bearish green hammer).
>>> Signal Cleanup - Bar Doji Skip: Skip doji (indecisive) candles signals.
>>> Signal Cleanup - EWO (Elliott Wave Oscillator): Include EWO (Elliott Wave Oscillator), LONG will only be opened if EWO is bullish / SHORT if EWO is bearish.
>>> Signal Cleanup - VWAP (Volume-Weighted Average Price): Include VWAP (Volume-Weighted Average Price), LONG will only be opened if price is above VWAP / SHORT if price is below VWAP.
>>> Signal Cleanup - MA (Moving Average) Confirmation: Include MA (Moving Average), LONG will only be opened if MA is bullish / SHORT if MA is bearish.
>>> Signal Cleanup - ATR (Average True Range): Include ATR (Average True Range) confirmation, LONG will only be opened if ATR is bullish / SHORT if ATR is bearish.
>>> Signal Cleanup - Divergence(RSI + MACD): Include Divergence (RSI[Relative Strength Index] + MACD[Moving Average Convergence Divergence]) confirmation, LONG will only be opened if Divergence is bullish / SHORT if Divergence is bearish.
>>> Signal Cleanup - Volume % Strength: Volume % Strength: Include Volume strength/percentage confirmation, LONG/SHORT will only be opened with strong Volume matching the signal direction | By default, strong Volume percentage is set to 150% and weak to 50%.
>>> Signal Cleanup - Volume Above Average: Volume Above Average: Include Volume Above Moving Average (Volume closing bar closes above volume moving average) confirmation, LONG/SHORT will only be opened with Volume above average - Volume closed bar color must match the closed price color (bullish/bearish direction) + Volume bar must be closed above volume MA line).
-
Adding Alerts in TradngView:
-Add indicator to chart and make sure the correct strategy is configured (check Backtesting results)
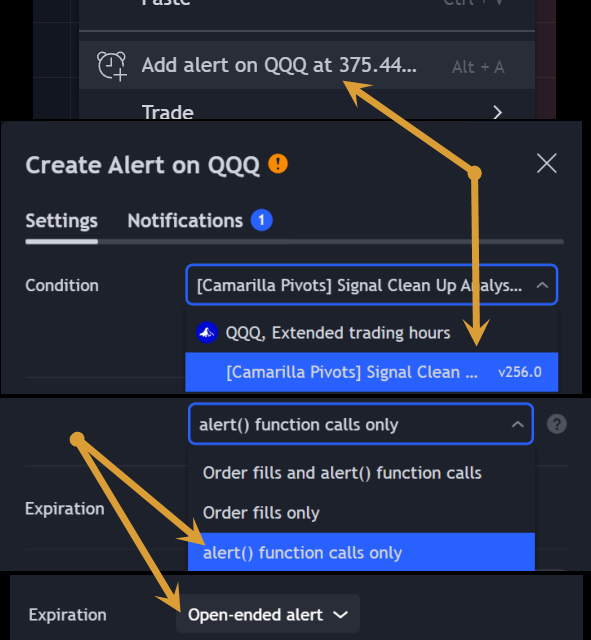
-Right-click anywhere on the TradingView chart
-Click on Add alert
-Condition: Select this indicator by it’s name
-Immediately below, change it to "alert() function calls only", as other wise there will be 2 alerts for every alert!
-Expiration: Open-ended (that may require higher tier TradingView account, otherwise the alert will need to be occasionally re-triggered)
-Alert name: Anything
-Hit “Create”
-Note: If ANY Settings within the indicator will be changed > DELETE the current alert and create a new one per steps above, otherwise it will continue triggering alerts per old Settings!
-
Reading Alerts in TradngView:
NOTE: Each label ["COIN"], ["ENTRY"], etc. is customizable, the text can be changed of it within indicator Input settings.
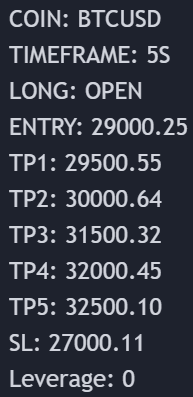
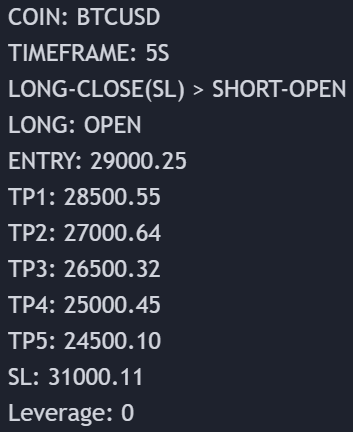
Here are 2 examples of a 1)LONG OPEN alert and a )LONG SL > IMMEDIATE SHORT OPEN alert:
1)
2)
The labels are pretty much self-explanatory, but just in case:
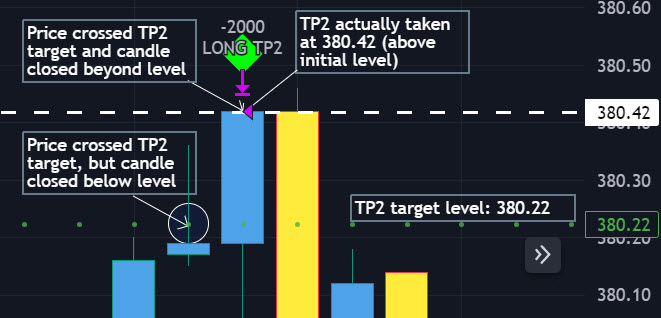
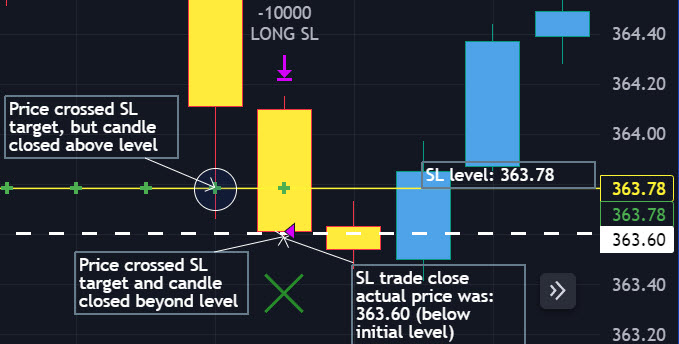
NOTE: take-profit and stop-loss levels are considered reached only when candle bar closes beyond the level (therefore take-profit/stop-loss actual prices will be slightly different than initially shown)! Here are 2 examples with 1)TP and 2)SL crossed/touched vs actually reached/taken:
1)
2)
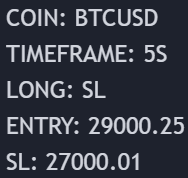
- COIN: Instrument which will be traded
- TIMEFRAME: Timeframe of the chart at which algorithm is working
- LONG: Direction of the trade and indication of the trade to be open
- ENTRY: Price at which the trade is open (stocks purchased)
- TP1: 1st take-profit target
- TP2: 2st take-profit target
- TP3: 3st take-profit target
- TP4: 4st take-profit target
- TP5: 5st take-profit target
- SL: stop-loss level at which trade/position will be closed at loss
- Leverage: this an informational label of leverage, does not affect the algorithm in any way
With each trade/position alert, there is all the necessary information included.
Mainly it's: Open (direction) or Close (partially/full) at alert!
Here are several alerts demonstrated:
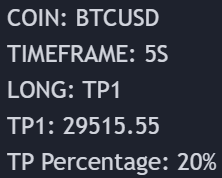
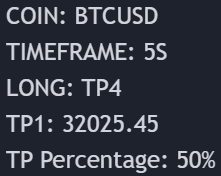
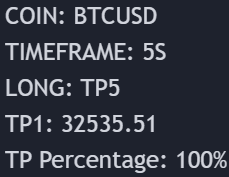
"TP PERCENTAGE" - the amount by which the current trade or position should be decreased, partially closed, or sold.
TP System: Dynamic
"TP PERCENTAGE" - will always be the same amount (trade/position size divided by the # of take-profit(TP) targets) and percentage to be decreased, partially closed, or sold will always be of the ORIGINAL trade/position.
TP System: Static
"TP PERCENTAGE" - will always be the same amount IF take-profit(TP) targets are hit 1-by-1 (TP1 > TP2 > TP3 > TP4 > TP5), otherwise it will vary and unless it is a 1st take-profit(TP1), the REMAINING trade/position size will always be smaller than original and therefore the percentage to be decreased, partially closed, or sold will always be of the REMAINING trade/position and NOT the original one!
TP Percentage Cheat Sheet
- Check current trade size.
- Multiply it by the decimal value next to "TP PERCENTAGE" received in the signal/alert.
- The result represents the quantity of units, stocks, contracts, etc. that should be reduced, partially close, or sell.
| TP PERCENTAGE | Close/Sell Amount | Example (trade size: 50 stocks) |
|---|---|---|
| 20% | trade size * 0.2 | 50 * 0.2 = 10 stocks |
| 25% | trade size * 0.25 | 50 * 0.25 = 12.5(~13) stocks |
| 34% | trade size * 0.34 | 50 * 0.34 = 17 stocks |
| 40% | trade size * 0.4 | 50 * 0.4 = 20 stocks |
| 50% | trade size * 0.5 | 50 * 0.5 = 25 stocks |
| 60% | trade size * 0.6 | 50 * 0.6 = 30 stocks |
| 66% | trade size * 0.66 | 50 * 0.66 = 33 stocks |
| 75% | trade size * 0.75 | 50 * 0.75 = 37.5(~38) stocks |
| 80% | trade size * 0.8 | 50 * 0.8 = 40 stocks |
| 100% | trade size | 50 = 50 stocks |
In the rare event that a portion of the current or remaining trade closes slightly inaccurately, there's no need for concern. These occurrences are infrequent, and even if there's a minor discrepancy in the partial take profit (TP) closure, it doesn't significantly impact the overall performance of our algorithms.
History
![]() of Camarilla Pivots
of Camarilla Pivots
(Click or Tap to expand)
The concept of Camarilla pivot points was initially introduced in 1989 by Nick Scott, who was a former bond trader and held the position of president at Camarilla Equities Ltd. This system is specifically designed to furnish traders with support and resistance levels, which are derived from the previous day's price movements. The foundational idea behind Camarilla pivots is rooted in the belief that price behavior often follows a pattern, and by pinpointing significant support and resistance levels, traders can enhance their ability to make well-informed decisions about their trading activities.
Our contribution to the Camarilla Pivots concept includes the integration of a sophisticated signal cleanup and analysis algorithm, working in harmony with the foundational Camarilla Pivot formulas. This innovative augmentation, coupled with several improvements, has significantly magnified the potential for substantial profits across a diverse array of trading instruments. Furthermore, our algorithm ensures alerts are issued at every juncture of a trade, essentially metamorphosing it into a comprehensive full-cycle trading system.
Our contribution to the Camarilla Pivots concept includes the integration of a sophisticated signal cleanup and analysis algorithm, working in harmony with the foundational Camarilla Pivot formulas. This innovative augmentation, coupled with several improvements, has significantly magnified the potential for substantial profits across a diverse array of trading instruments. Furthermore, our algorithm ensures alerts are issued at every juncture of a trade, essentially metamorphosing it into a comprehensive full-cycle trading system.
Check out our other indicators:
>>>>>> [Camarilla Pivots] with Signal Clean Up Analysis and Alerts (TSO)
> [Day Trading Indicator] EMA Cloud Scalping (TSO)
> [Opening Range pre-Market Breakout Screener] with Alerts (TSO)
> [Opening Range Breakout] Support and Resistance with Backtest (TSO)
> [Options Covered Calls/Puts with TA] with Alerts (TSO)
> [Round Numbers] with Signal Clean Up Analysis and Alerts (TSO)
> [Auto Trend Lines] with Backtest (TSO))
> [Pivots Consolidation Breakout Screener] with Alerts (TSO)