Selling Covered Options (calls | puts) Visual System
- Multi-Symbol - up to 3 instruments/symbols per single indicator
- Alerts - Strike/Break Even hits, Expiration Day, Support and Resistance/Trend Line Breakouts
- TA (Technical Analysis) with unique visual aid specifically developed for Options Selling Trading
- Organized Stats Table showing all important live trade data for each options trading setup
This trading indicator assists with traditional covered options trading strategies like Covered Calls, Covered Puts, and Cash Secured Puts. It also offers advanced features for trading options intelligently by utilizing options specific levels, such as BE (Break Even) and Strike (all visually shown on chart) in combination with S&R (Support and Resistance), Trend Lines, and other technical analysis tools such as MA (Moving Averages) and ATR Average True Range, all integrated within the indicator.
-
Covered options approach over trading shares or options separately offers distinct advantages:
- Reduced Risk and Flexibility: Covered options strategy provides a more conservative approach by combining stock ownership with options trading. It reduces risk exposure compared to buying options outright or trading shares alone. Additionally, it offers flexibility in various market conditions.
- Profitability in Sideways Markets: Covered options allow for profitability in scenarios where the stock price is either moving optimally or remaining sideways. In contrast, just holding stocks might not yield significant gains in a sideways market, and buying options can result in losses due to time decay.
- Protection Against Price Movements: In covered options, if the stock price goes against the trade, the loss is mitigated by the premium received from selling the options. This provides a level of protection compared to other trading strategies where losses can accumulate more rapidly.
Options
![]() 101
101
(Click or Tap to expand)
What are Options?
-
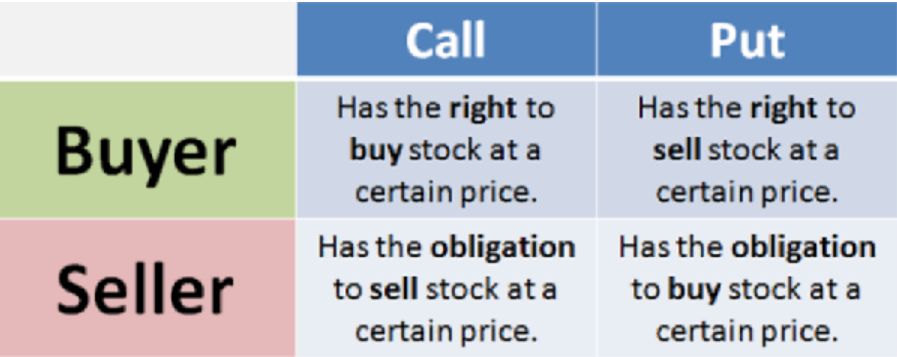
An Option is a contract sold from Seller (writer) to Buyer, which gives buyer the right (but not obligation) to purchase a stock at a specific price - Strike (if stock price is getting closer or breaking beyond the Strike - option contracts increase in value, if stock price goes away from the Strike - options contracts decrease in value), on or before the specified date - Expiration Date (the closer the Expiration Date is - the lower the value of the option contract is (option's time decay), once contracts expire - they become worthless).
-
An Options trade or a position is opened when an option is either bought or sold, which is then closed with an opposite action or when option Expires.
-
BTO (Buy to Open): option contracts are purchased at Ask price. To close such trade, same type of options must be sold STC (Sell to Close) at Bid price unless contracts expire.
-
STO (Sell to Open): option contracts are sold at Bid price. To close such trade, same type of options must be bought back - BTC (Buy to Close) at Ask price unless contracts expire.
- Premium: feed paid by buyer to seller for purchasing options (Premium = 1 contract price * 100).
- Strike Price: predetermined price at which an option can be bought or sold when it's exercised/assigned.
- ITM/OTM/ATM: ITM (In the Money): market price is beyond (Calls: above | Puts: below) the Strike Price. | OTM (Out of the Money): market price is outside (Calls: below | Puts: above) the Strike Price. | ATM (At the Money): market price is equal to Strike Price.
- Expiration Date: option contracts become worthless at the end of trading session day on Expiration date, without reaching the Strike price.
- BE (Break Even) Point: for an options seller, BE (Break Even) price is the stock price at which after contracts expire and the stock is sold(Covered Calls)/bought-to-cover(Covered Puts)/bought(Cash Secured Puts) - there will be no loss or profit. NOTE: When contracts expire the stock price by that point may already be beyond the BE (Break Even) price and not exactly at it, BE (Break Even) is still very useful as it can be used in combo with Technical Analysis. Also, if options contracts are still not expired, exiting out of the trade at BE (Break Even) price will incur a loss of buying the contracts back - BTC (Buy to Close).
- Assignment: obligation to purchase or sell stock shares (100 shares per contract) at the Strike price (considering the stock price is at or beyond the Strike price). Assignment may occur at stock price breaking the Strike price before Expiration or will automatically occur at stock closing at/beyond the Strike price at Expiration date at the end of the trading session day (For example, for a typical regulated US broker (Charles Schwab for example), if a sold/STO (Sell to Open) option contract expires today and it is ITM (In the Money) at 5:30PM ET (NOTE: this is beyond market hours, so even after market closes - option contract may go from OTM to ITM and vice versa as price of the stock can still move afterhours!), options will be auto-assigned with 100 SPY shares per each contract at Strike price).
- Extrinsic Value: Extrinsic value is the difference between the market price of an option, also known as its premium, and its intrinsic price, which is the difference between an option's strike price and the underlying asset's price. Extrinsic value rises with increase in volatility in the market.
- Intrinsic Value: Intrinsic value is a measure of what an asset is worth. The intrinsic value of both call and put options is the difference between the underlying stock's price and the strike price.
-
BTO (Buy to Open): option contracts are purchased at Ask price. To close such trade, same type of options must be sold STC (Sell to Close) at Bid price unless contracts expire.
-
-
An mentioned before, Option contract typically represents 100 shares of stock per each contract. There are different approaches on selling Options:
- Covered Options: each options contract is backed up by a LONG or a SHORT trade of 100 shares of the underlying stock per 1 contract.
- Cash Secured Options: options contract sold, without owning the underlying stock with available cash to cover the stock purchase in case of assignment.
- Naked Options: options contract sold, without owning the stock or having enough cash to cover the stock purchase in case of assignment.
- Mixed Options: there are various advanced options strategies out there, like spreads, butterflies and so on where different options contracts are bought and sold at the same time.
-
An mentioned before, Option contract typically represents 100 shares of stock per each contract. There are different approaches on selling Options:
-
-
Call option contract: increases in price at stock rise (↑).
- BTO [Buy to Open] - Buyers of calls options are usually expecting the stock to rise rapidly (if price rises slowly > option's time decay will eat away potential profits) in price to re-sell the options at a bigger price.
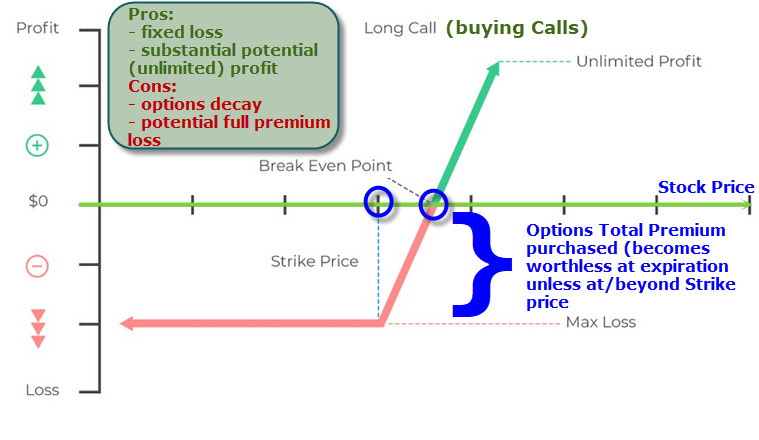
* If stock goes up > buyer can profit by re-selling options at a bigger price before Expiration (can also purchase the stock at Strike price, which usually never happens as buying and then re-selling naked calls is a pure speculation trading approach).
* If stock goes sideways > options will decay by losing its value over time.
* If stock goes down > options will go down in price + lose value over decay.Buying then selling calls is often used as a day trading strategy (LONG trades). With very tight Strike and 1-3 days Expiration date, it allows for more rapid changes in the contract price with minimal stock price movements.
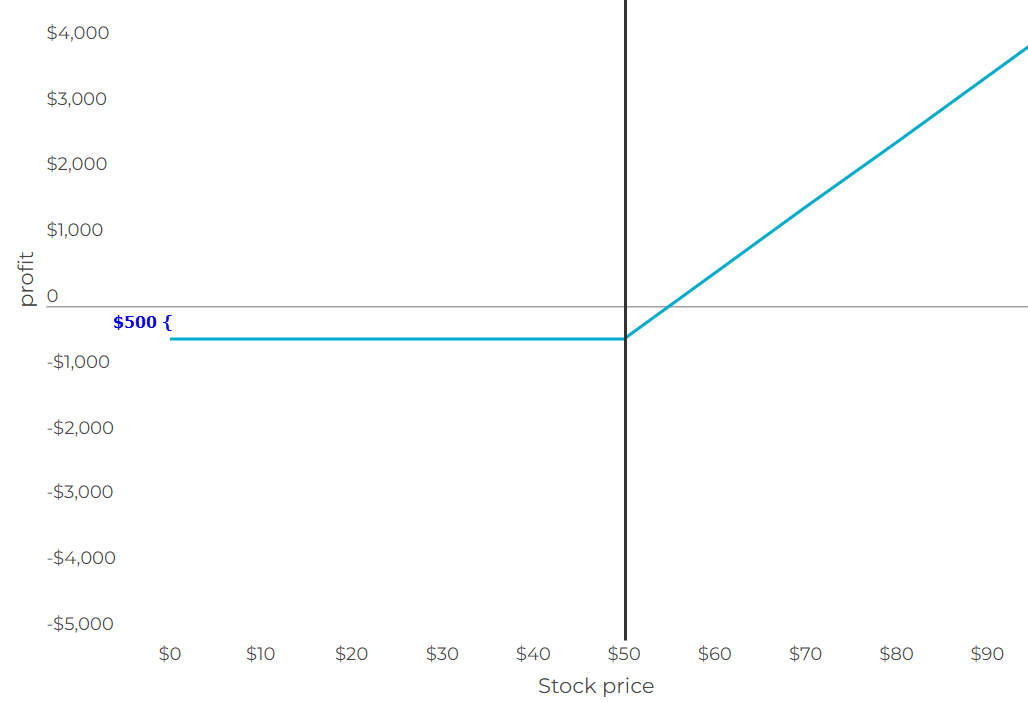
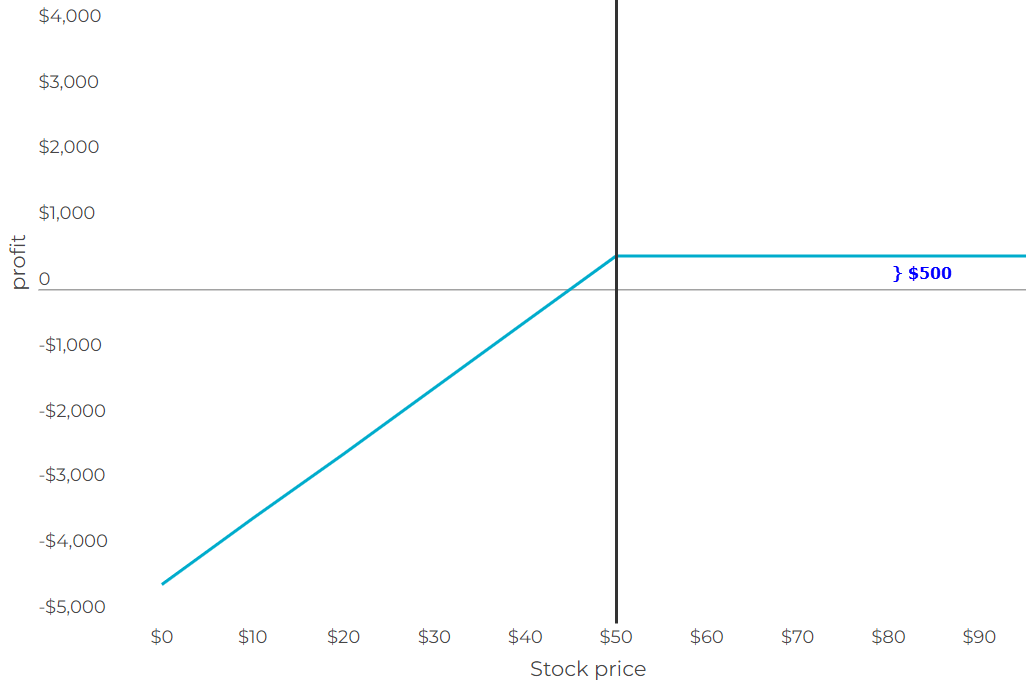
In the given scenario, an AMD call option with a $50 strike price is available for a $5 premium and expires in 3 days. Each call contract, representing 100 shares, costs $500 ($5 premium x 100 shares).
For every $1 increase in the stock price above the $50 strike price, the option's total value increases by $100. The breakeven point, where the option starts to earn money or becomes "in the money," is $55 per share ($50 strike price + $5 call cost). Between $50 and $55, the buyer recoups part of the initial investment, but the option doesn't show a net profit.
Once the option is in the money or above the breakeven point, its value is unlimited because the stock price could continue to climb. If the stock trades below the strike price, rendering the option out of the money, it becomes worthless, capping the investor's maximum loss at the initial outlay of $500.
- STO [Sell to Open] - Sellers of covered calls (secured by 100shares per each contract) options are usually expecting the stock to go sideways/rise (→↑).
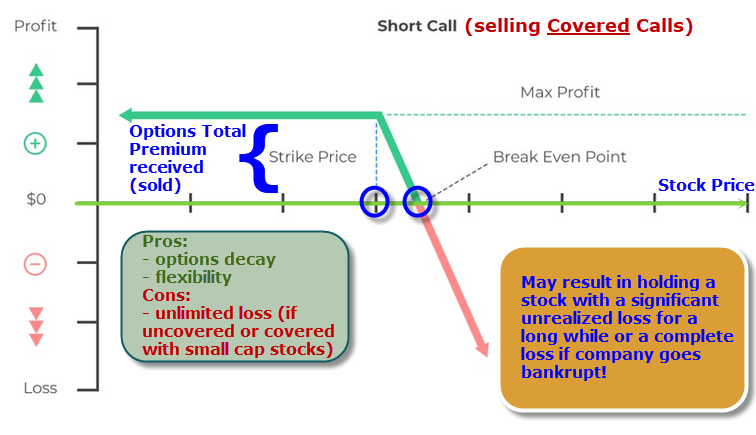
* If at Expiration stock ends up beyond the Strike price > seller keeps the premium received for selling the option contracts and then gets assigned, therefore profiting from premium + difference from selling the stock at a higher price and is left with cash.
* If at Expiration stock never reaches the Strike price > seller simply profits from premium received for selling the option contracts and is left with stock shares.
* If at Expiration stock goes below the Stock Purchase Price > seller profits from premium received for selling the option contracts and is left with stock shares, if the stock continues declining > seller may go into an unrealized loss for a long while or even at a complete loss if the company of the stock goes out of business.In the given scenario, AMD stock is trading at $50 a share, and calls with a $50 strike price can be sold for a $5 premium, expiring in 1 week. Each call contract, representing 100 shares, is sold for $500 ($5 premium x 100 shares).
As each contract stands for 100 shares, for every $1 increase in the stock above the strike price, the option's cost to the seller rises by $100. The breakeven point for the call is $55 per share, calculated as the strike price plus the cost of the call. Beyond this point, the call seller begins to incur losses, and potential losses are unlimited. If the stock trades between $50 and $55, the seller retains some premium but not the full amount. If the stock trades below the strike price, the option's value flatlines, capping the seller's maximum gain at $500.
Call sellers can receive at most the contract premium ($500), but they must be prepared to deliver the stock at the strike price if called by the buyer. Potential losses theoretically have no upper bound if the stock price continues to rise, exposing call sellers to more significant losses than their initial position's premium.
-
Put option contract: increases in price at stock decline (↓).
- BTO [Buy to Open] - Buyers of puts options are usually expecting the stock to decrease in price rapidly (if price falls slowly > option's time decay will eat away potential profits) to re-sell the options it bigger price.
* If stock goes down > buyer can profit by re-selling options at a bigger price before Expiration (can also purchase the stock at Strike price, which usually never happens as buying and then re-selling naked puts is a pure speculation trading approach).
* If stock goes sideways > options will decay by losing it's value over time.
* If stock goes up > options will go down in price + lose value over decay.Buying then selling puts is often used as a day trading strategy (SHORT trades). With very tight Strike and 1-3 days Expiration date, it allows for more rapid changes in the contract price with minimal stock price movements.
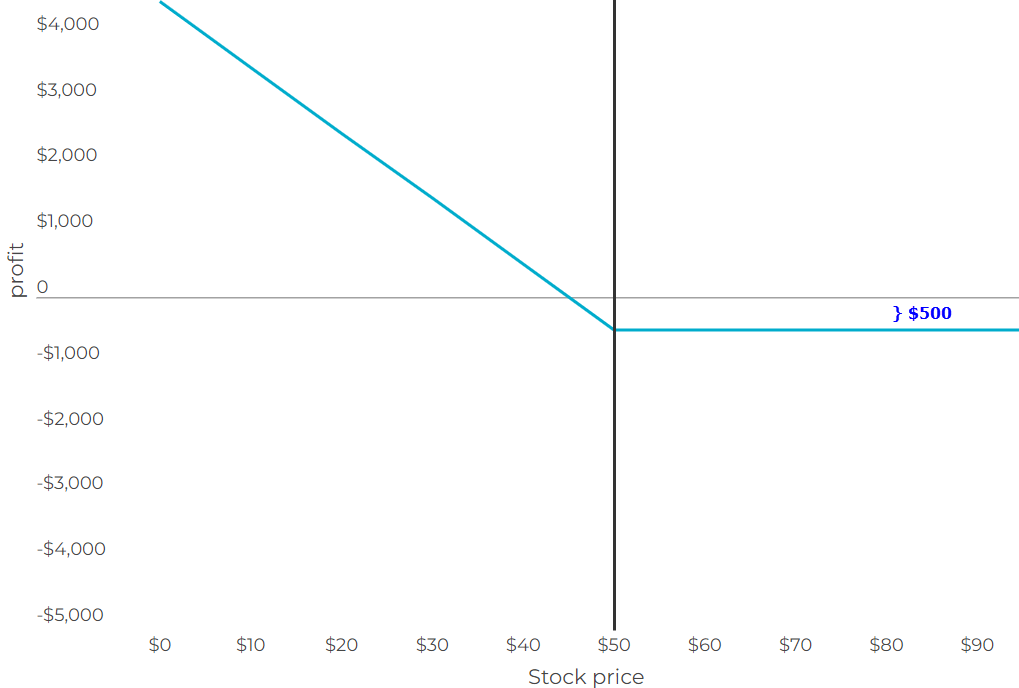
AMD, currently valued at $50 per share, has put options with a $50 strike price available for a $5 premium, expiring in 3 days. A single put contract is priced at $500 ($5 premium x 100 shares).
Given that each contract represents 100 shares, for every $1 drop in the stock price below the strike price, the option's total value increases by $100.
Put options start to become profitable, have intrinsic value, or be considered "in the money" when they fall below the break-even point. The break-even point is determined by subtracting the put's cost from the strike price, resulting in $45 in this case ($50 - $5 = $45). If the stock trades between $45 and $50, the option retains some value but doesn't yield a net profit.
On the other hand, if the stock remains above the $50 strike price, the option is deemed "out of the money" and becomes worthless. Consequently, the option value remains flat, limiting the investor's maximum loss to the premium paid for the put, which is $5 per share or $500 in total.
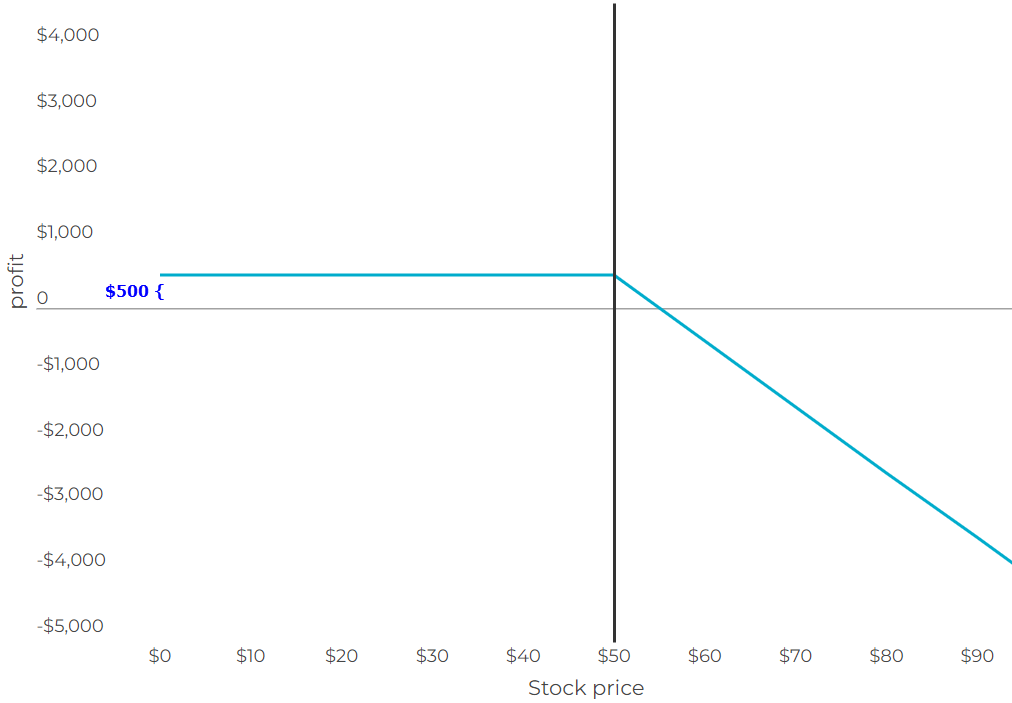
- STO [Sell to Open] - Sellers of covered puts (secured by 100shares per each contract) options are expecting the stock to go sideways/decline in price (→↓).
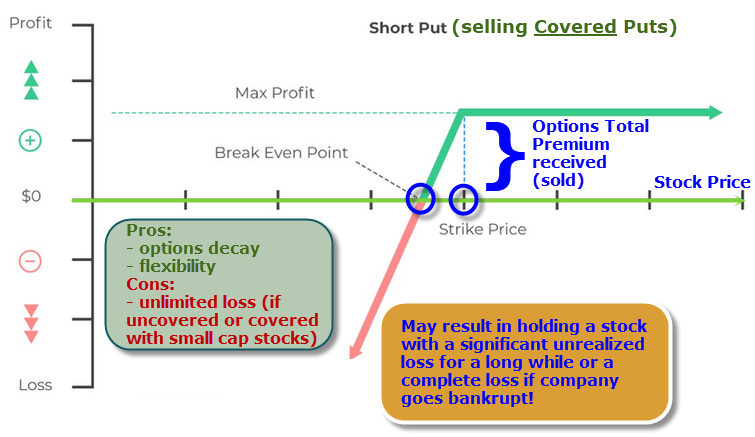
* If at Expiration stock ends up beyond the Strike price > seller keeps the premium received for selling the option contracts and then gets assigned, therefore profiting from premium + difference from short-selling the stock at a lower price and is left with cash.
* If at Expiration stock never reaches the Strike price and never goes above the Stock Purchase price (as there is a still short trade open) > seller simply profits from premium received for selling the option contracts.
* If at Expiration stock goes above the Stock Purchase Price > seller profits from premium received for selling the option contracts and is left with stock shares, AND with an open short trade, which is at loss, since it is a short-sold stock, which went up in price since purchase. With stock never declining below the short-sell price - it will have to be bought-to-cover (basically close the trade) at a loss as if stock continues going up - the loss can grow unlimited!AMD, trading at $50 a share, has put options with a $50 strike price that can be sold for a $5 premium, expiring in 1 week. One put contract is sold for $500 ($5 premium x 100 shares).
Each contract, representing 100 shares, results in a $100 increase in cost to the seller for every $1 decrease in the stock below the strike price. The break-even point is $45 per share, calculated as the strike price minus the premium received. The maximum profit for the put seller is capped at $5 premium per share, totaling $500. If the stock remains above $50 per share, the put seller retains the entire premium. As the stock declines, the put option incurs increasing costs for the seller.
Unlike put buyers, put sellers have limited upside and substantial downside. The maximum amount the put seller can receive is the premium of $500. However, if the buyer exercises the put option, the put seller must buy 100 shares of stock at the strike price. Potential losses could exceed the initial investment, reaching the entire value of the stock if it goes to $0. In this scenario, the put seller could incur a loss of up to $5,000 ($50 strike price paid x 100 shares) if the underlying stock reaches $0, as illustrated in the graph.
- [Sell to Open] - Sellers of cash secured puts options are expecting the stock to go sideways/rise to simply collect the option premium.
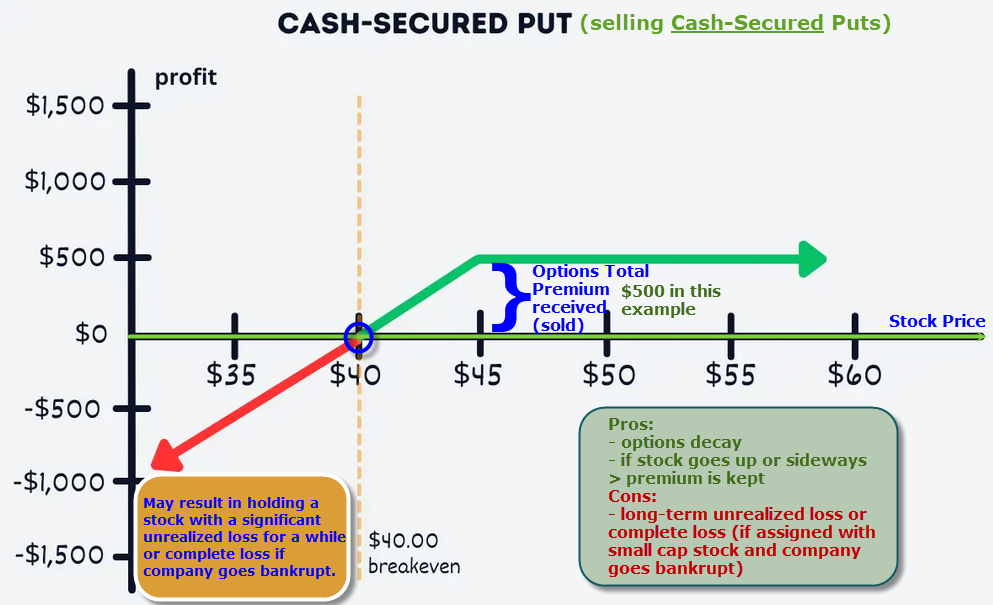
* If at Expiration stock never reaches the Strike price > seller simply profits from premium received for selling the option contracts.
* If at Expiration stock ends up beyond the Strike price > seller keeps the premium received for selling the option contracts and then gets assigned, therefore profiting from premium, while obtaining 100 shares per each contract at the Strike price. NOTE: If at Expiration stock ends up below the Strike price (actually below and not exactly at it) - seller ends up holding a stock at unrealized loss and if the stock will not recover above Strike price soon - seller may end up at an unrealized loss for a long while or even at a complete loss if the company of the stock goes out of business.
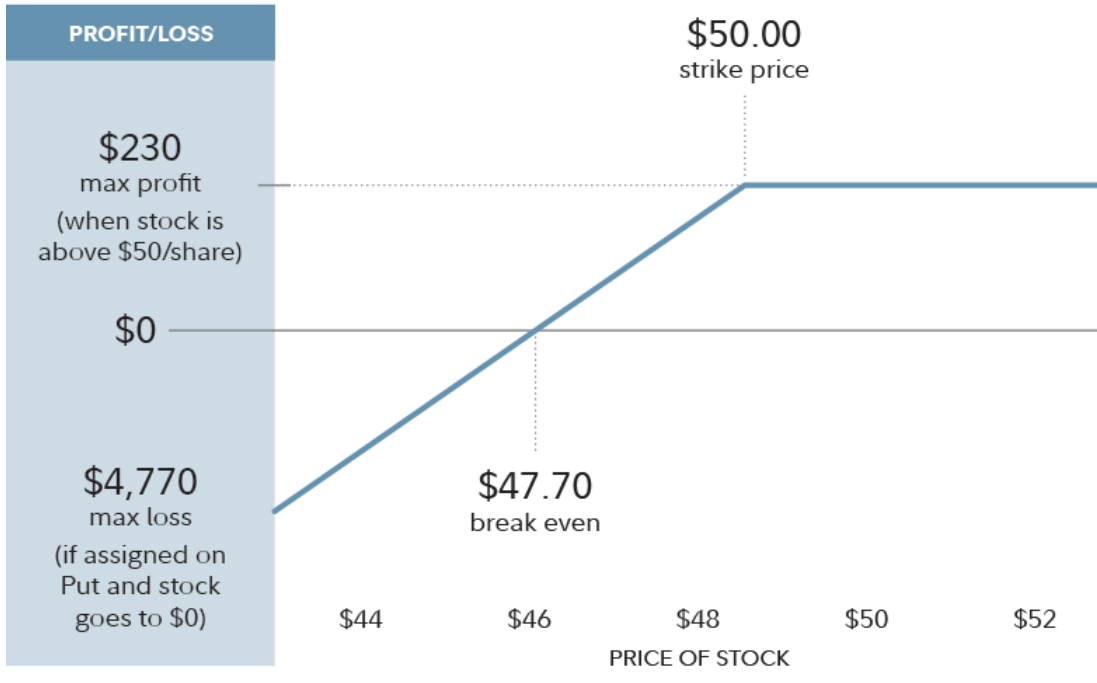
AMD, trading at $75 a share, has put options with a $50 strike price that can be sold for a $230 premium ($2.30 premium x 100 shares), expiring in 1 week.
If, at expiration, the stock is valued above $50 per share, the put option likely expires worthless, and you keep the premium. There's no obligation to purchase 100 shares of AMD, and you don't participate in additional profits if the stock continues to rise.
If the stock is below $50 at expiration, the contract is likely assigned, and you will buy 100 shares of AMD. The shares are automatically purchased at the strike price of $50, but since you received $2.30 per share from selling the contract, your effective purchase price is $47.70 per share. After this, your gain or loss is based on the movement of AMD shares relative to your purchase price.
-
Call option contract: increases in price at stock rise (↑).
Options Basic Examples
-
Trade Open Trigger (Bullish/Sideway)
- S&R (Support and Resistance) or Trend Line broken, bounced off or simply near (if price is near/slightly crossing S&R/Trend Line > a bounce often takes place)
- Confirmation by additional TA (Technical Analysis) tools.
- EXAMPLE: Broken Resistance combined with a Trend Line up-bounce, confirmed by bullish 200EMA.
-
TP (Take-Profit)
- Contracts Expire at Expiration date: Premium received for selling contracts kept.
- Assignment: Premium received for selling contracts kept + stock assigned/sold at a higher price than it was purchased.
-
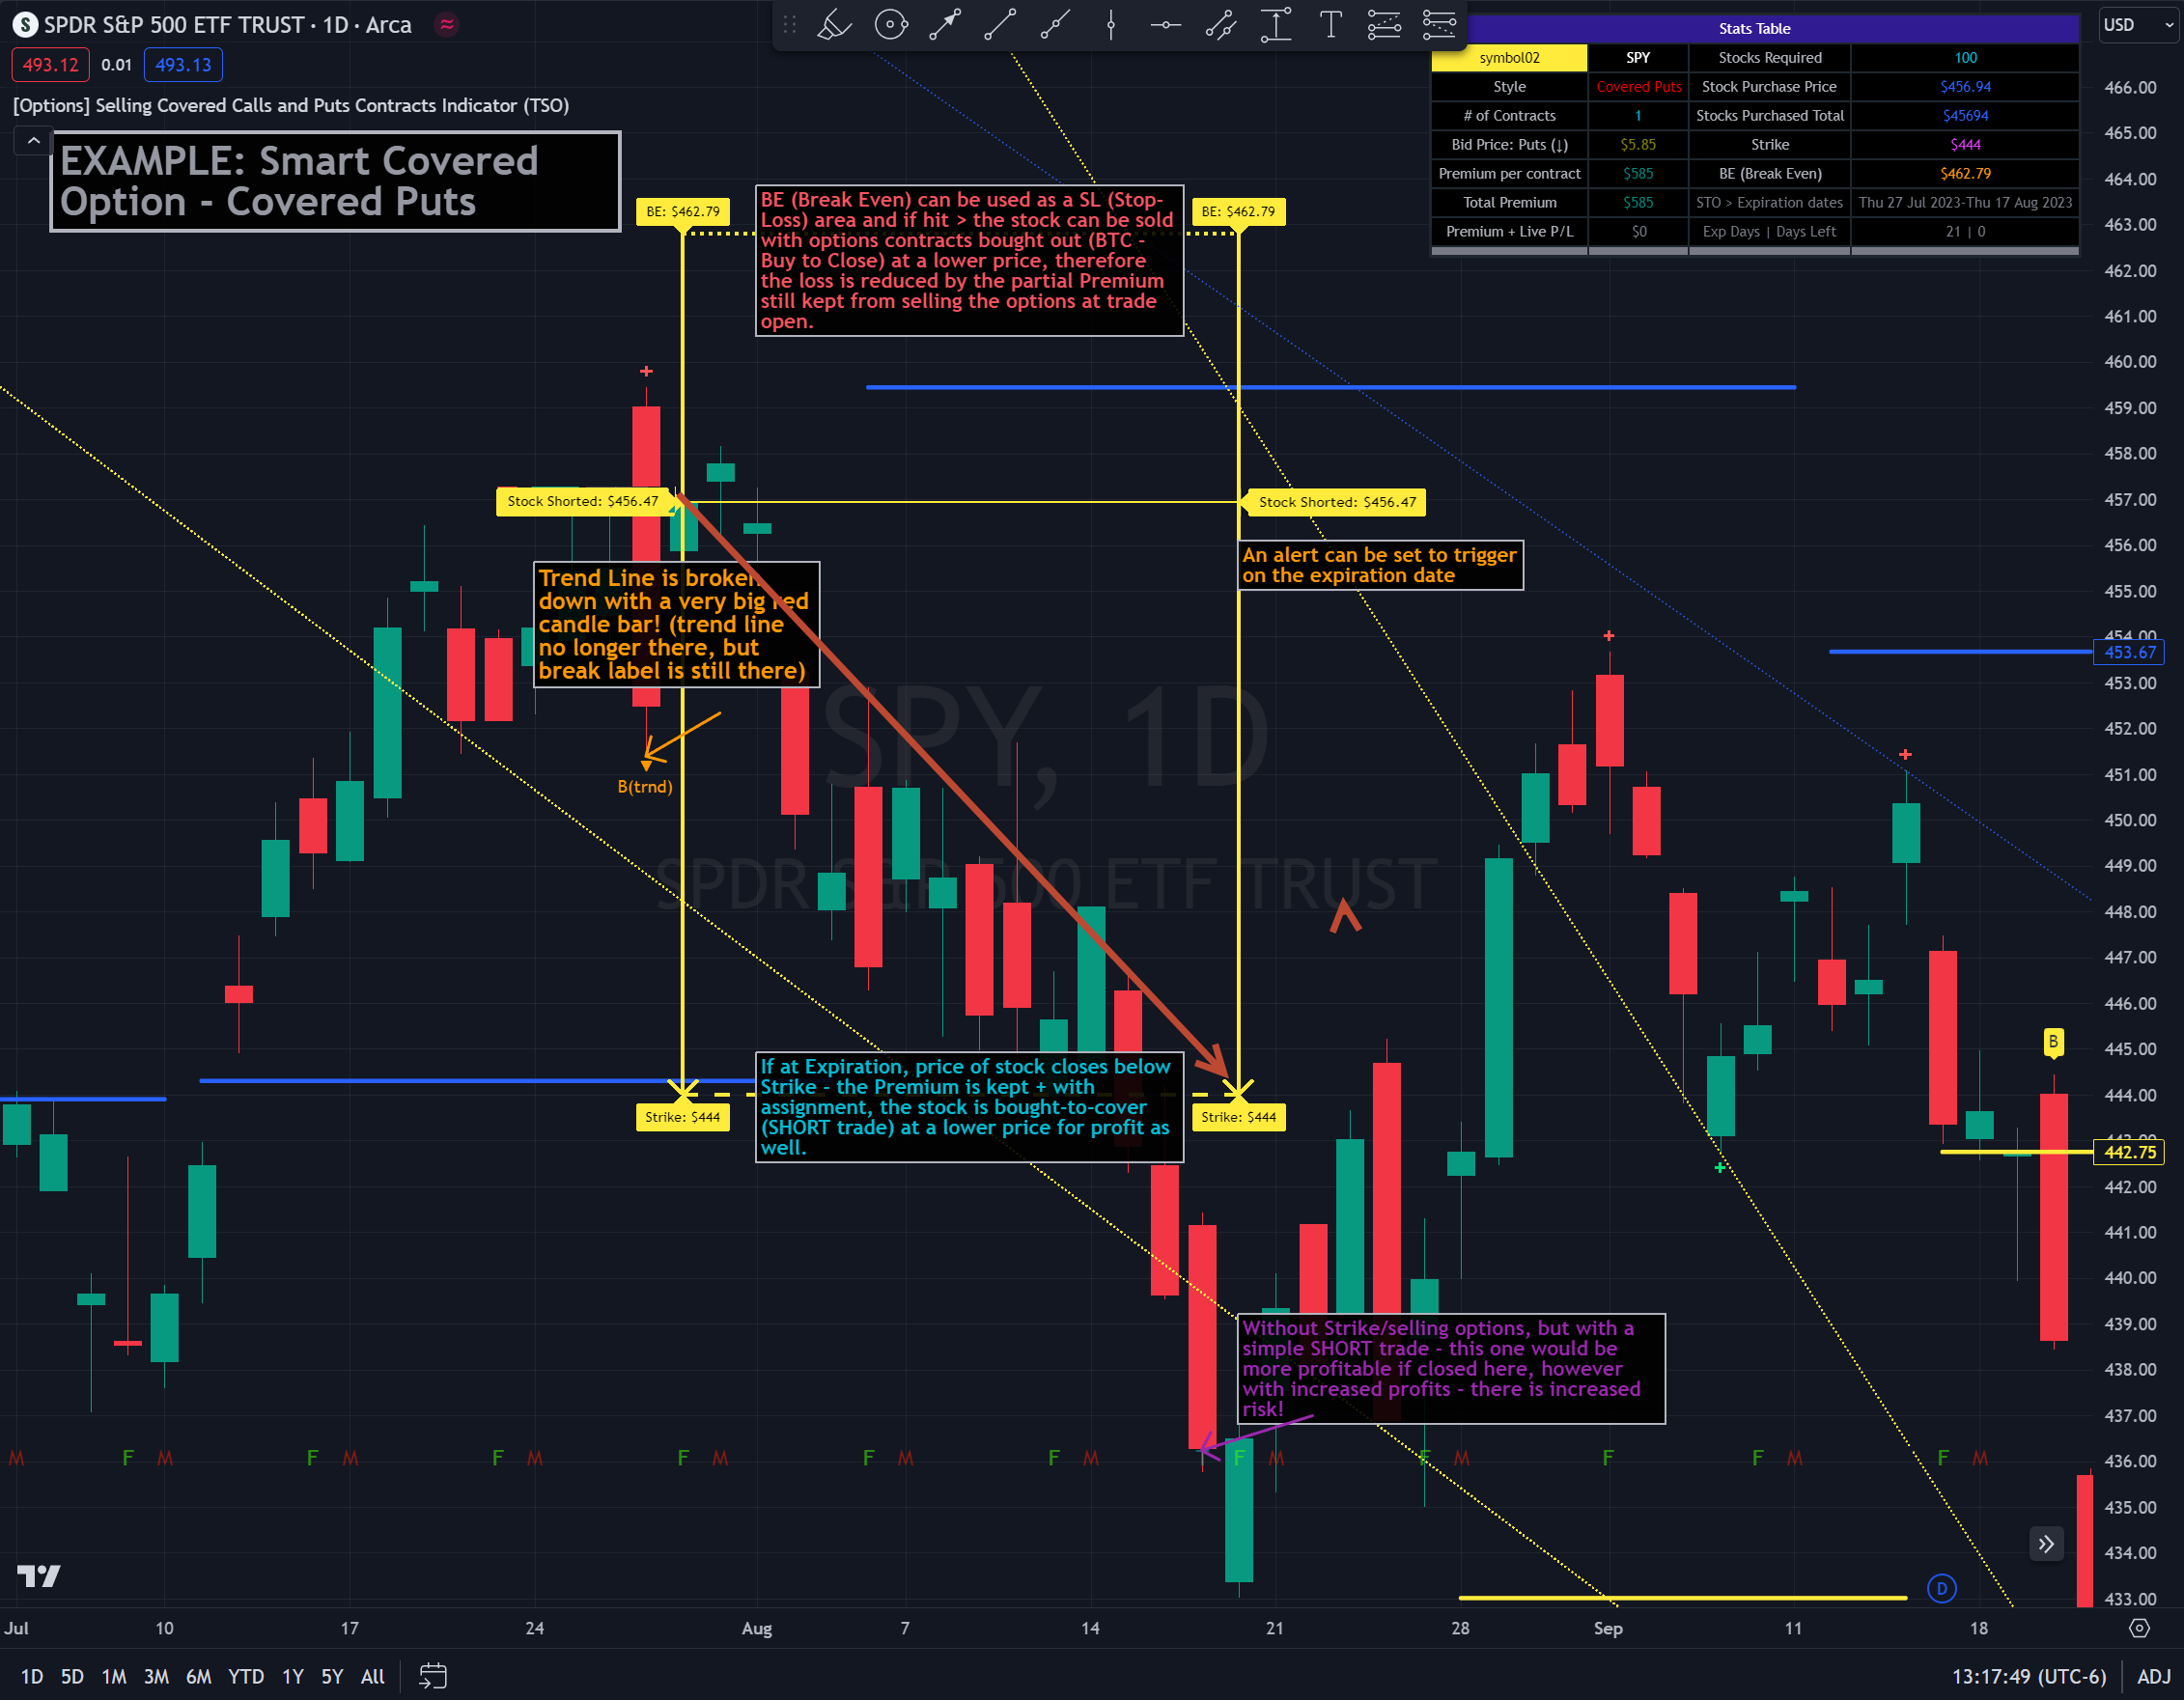
BE/SL (Break Even Stop-Loss) | [Covered Calls BE = Stock Purchase Price - Bid Price]
- BE/SL hit: stock sold at a slight loss with options contracts bought out (BTC - Buy to Close) at a lower price than initially sold (since price went down and these are calls), so technically the loss is reduced by the partial Premium still kept from initially sold contracts at trade open.
-
Increasing the BE/SL distance: for wider BE/SL > Bid Price needs to be increased:
- Set longer Expiration date.
- Set closer Strike price.
With longer Expiration date and closer Strike, chances of assignment increase as well. It's best to find an optimal level, where BE/SL is behind a Support/Resistance level and/or an established trend line and/or Large Length Moving Average, yet not extremely far away.
-
Trade Open Trigger (Bearish/Sideway)
- S&R (Support and Resistance) or Trend Line broken, bounced off or simply near (if price is near/slightly crossing S&R/Trend Line > a bounce often takes place)
- Confirmation by additional TA (Technical Analysis) tools.
- EXAMPLE: Broken Resistance combined with a Trend Line down-bounce, confirmed by bearish 200EMA.
-
TP (Take-Profit)
- Contracts Expire at Expiration date: Premium received for selling contracts kept.
- Assignment: Premium received for selling contracts kept + stock assigned/bought-to-cover at a lower price than it was shorted.
-
BE/SL (Break Even Stop-Loss) | [Covered Puts BE = Stock Purchase Price + Bid Price]
- BE/SL hit: stock bought-to-cover at a slight loss with options contracts bought out (BTC - Buy to Close) at a lower price than initially sold (since price went up and these are puts), so technically the loss is reduced by the partial Premium still kept from initially sold contracts at trade open.
-
Increasing the BE/SL distance: for wider BE/SL > Bid Price needs to be increased:
- Set longer Expiration date.
- Set closer Strike price.
With longer Expiration date and closer Strike, chances of assignment increase as well. It's best to find an optimal level, where BE/SL is behind a Support/Resistance level and/or an established trend line and/or Large Length Moving Average, yet not extremely far away.
-
Trade Open Trigger (Bullish/Sideway)
- Bullish steady trend.
- Confirmation by additional TA (Technical Analysis) tools.
- EXAMPLE: Slowly rising price action above 200EMA.
-
TP (Take-Profit)
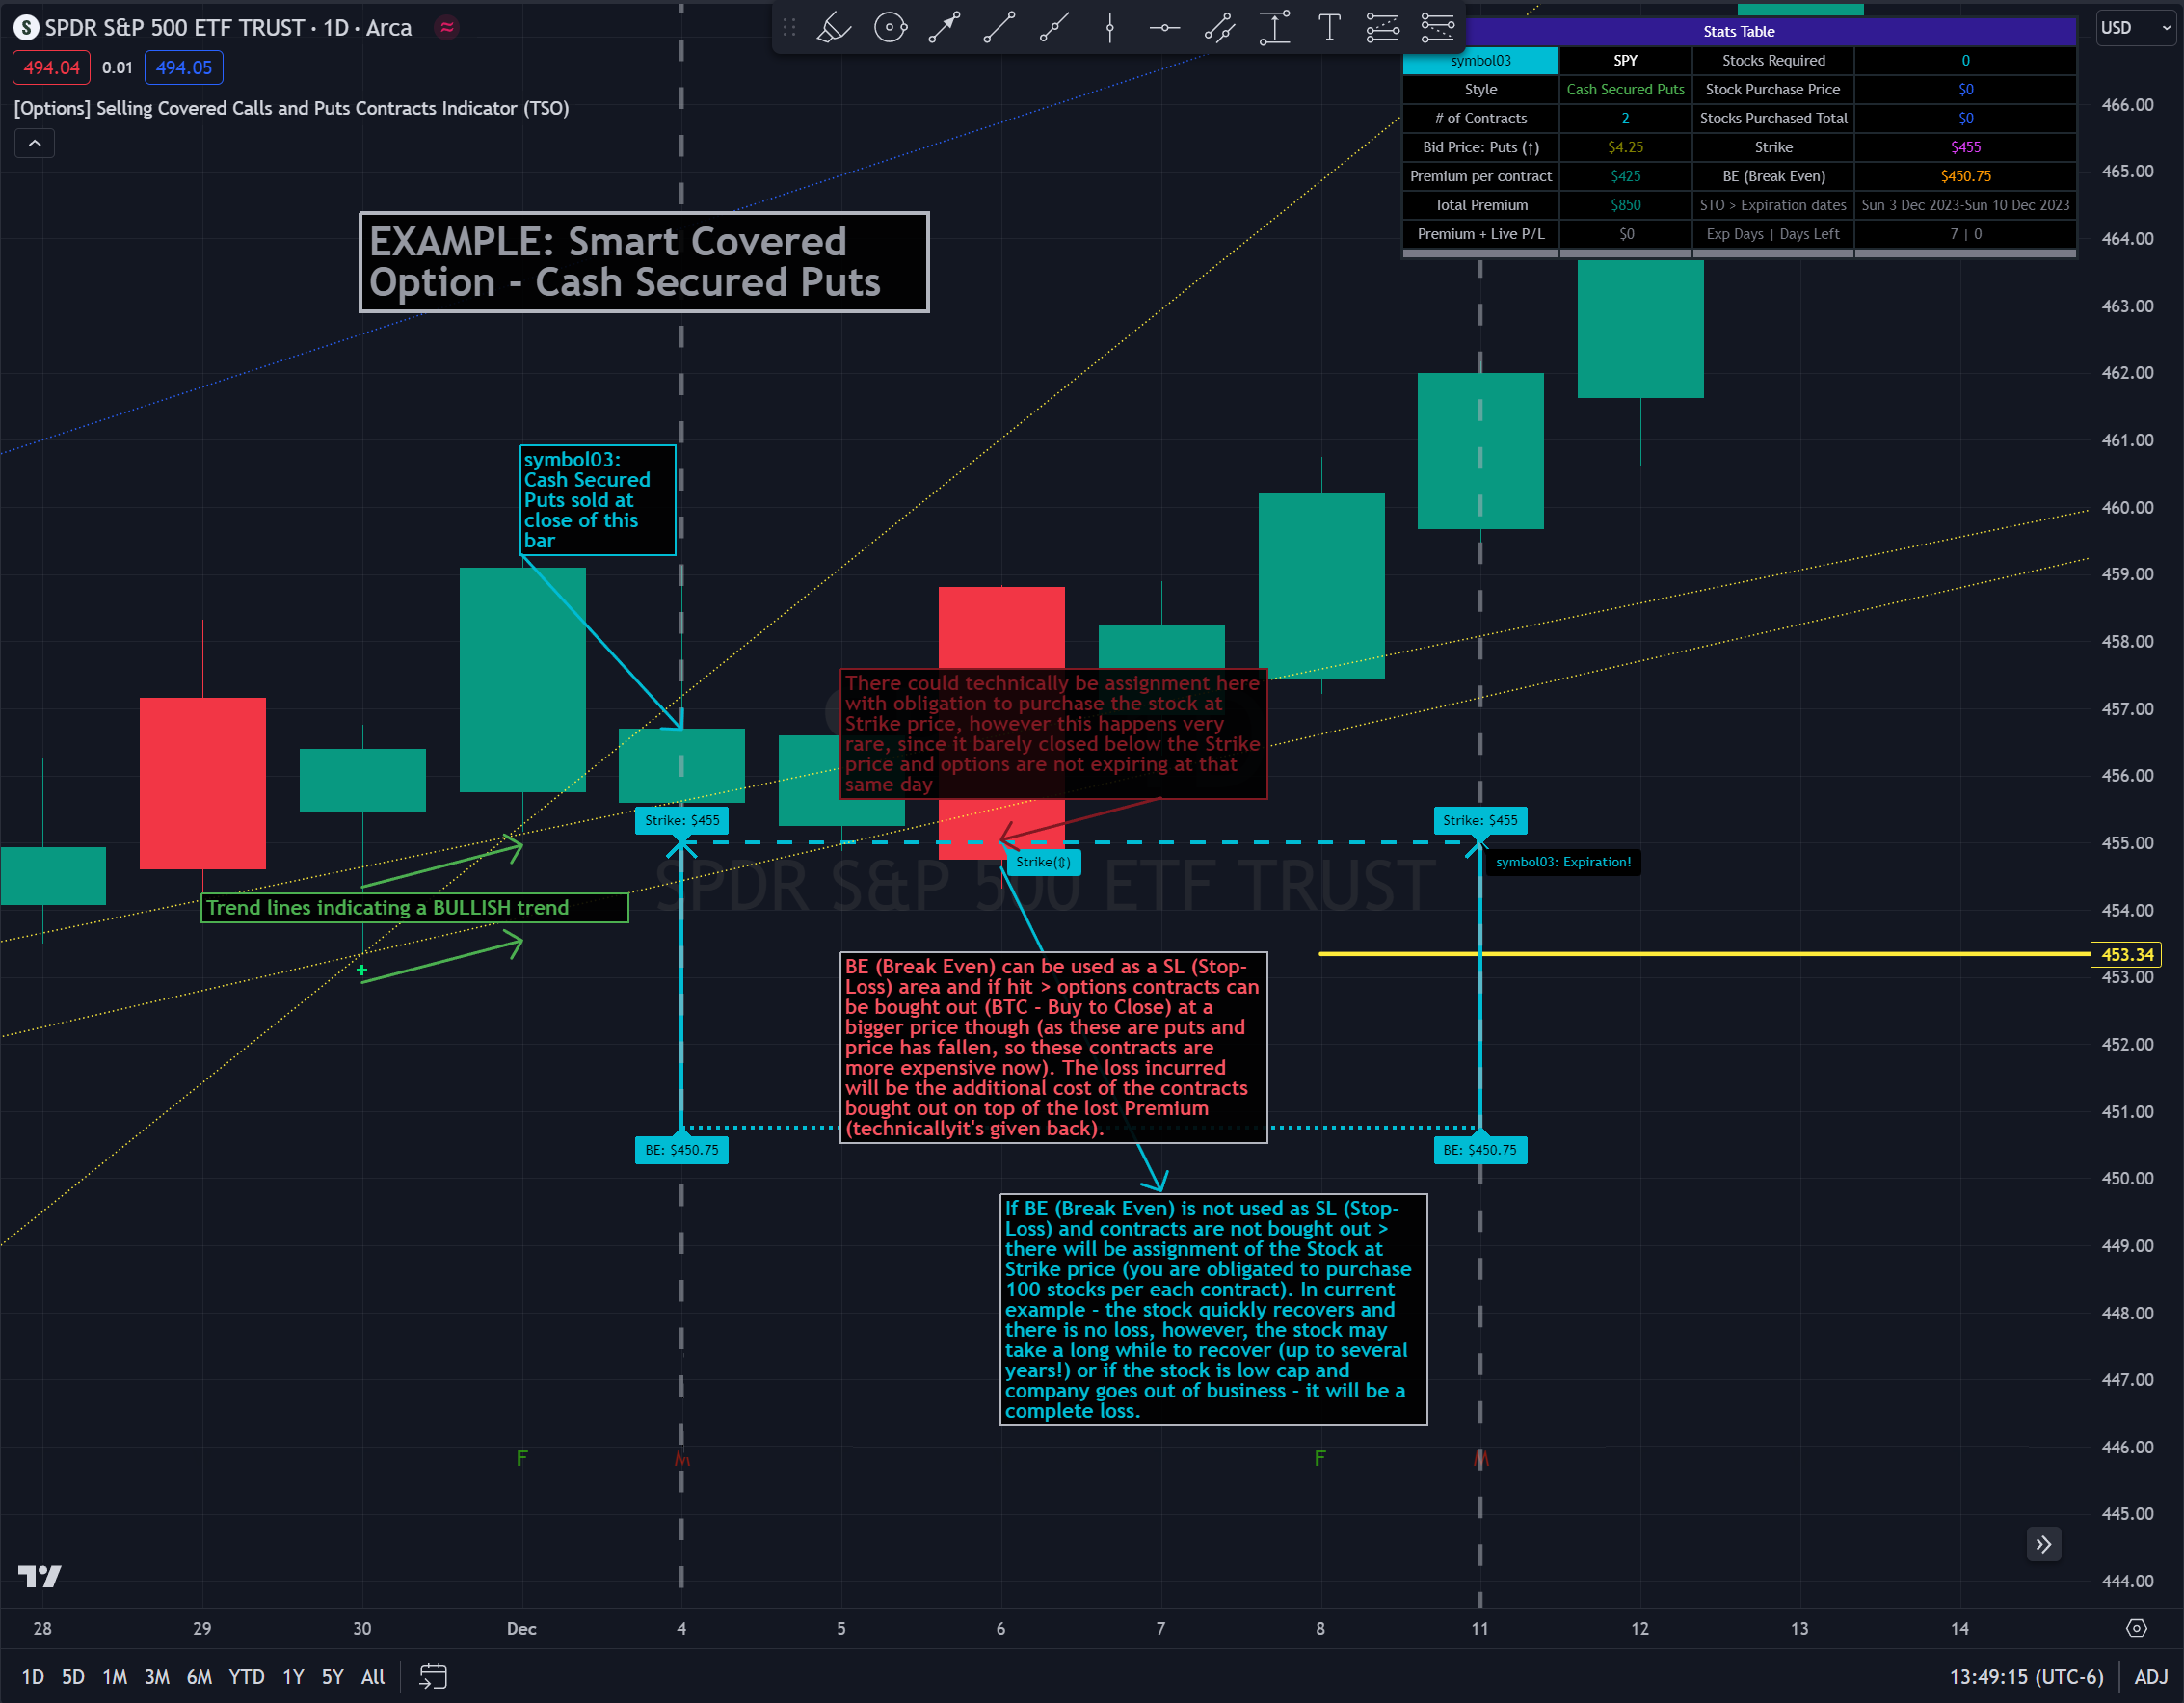
- Early BTC: BTC (Buy to Close) before Expiration date if options premium/contract price already reduced by at least 50-90% (the reduced price is the profit, if premium lost 90% - only 10% will need to be paid to buy options out to close the trade) and if the stock price is nearing Resistance, Trend Line or big length moving average (like 200EMA) as a bounce may happen or even a potential reverse of the trend. If there is no trend reversal or a small correction bounce occurs, with further trend continuation > another Cash Secured Puts trade can be opened with new Expiration date and Strike.
- Contracts Expire at Expiration date: Premium received for selling contracts kept, considering the Strike was never hit.
- Assignment with stock closing below Strike and above/near BE (Break Even): Premium received for selling contracts kept. NOTE: It is best to get rid of the stock ASAP to then open a new Cash Secured Puts trade with lower Strike and a new Expiration date.
-
BE/SL (Break Even Stop-Loss) | [Cash Secured Puts BE = Strike Price - Bid Price]
- BE/SL hit: contracts bought out (BTC - Buy to Close) at a higher price than initially sold (since price went down and these are puts), the amount/difference in current contract price is the loss (as premium received + contract price increase is the total cost, which will have to be paid to buy the contracts out).
-
Increasing the BE/SL distance: for wider BE/SL > Bid Price needs to be increased:
- Set longer Expiration date.
- Set closer Strike price.
With longer Expiration date and closer Strike, chances of assignment increase as well. It's best to find an optimal level, where BE/SL is behind a Support/Resistance level and/or an established trend line and/or Large Length Moving Average, yet not extremely far away.
-
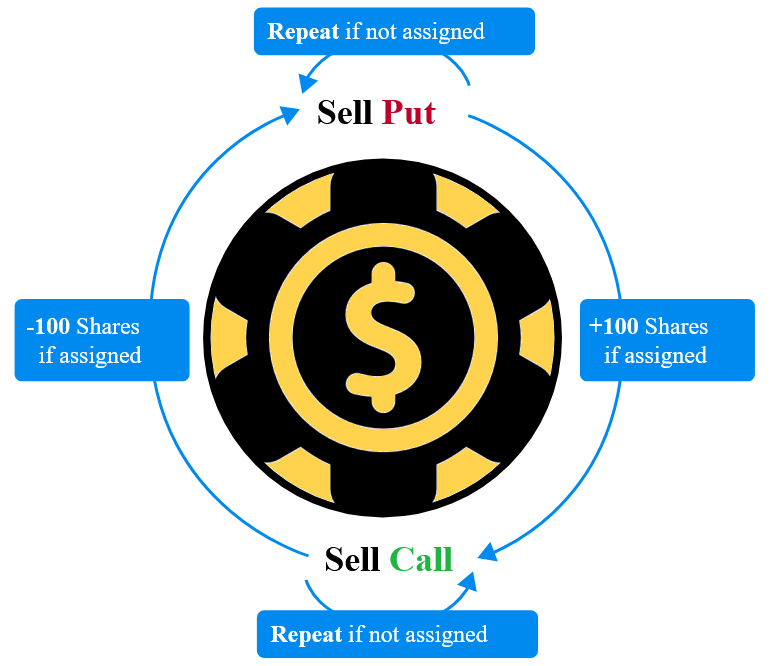
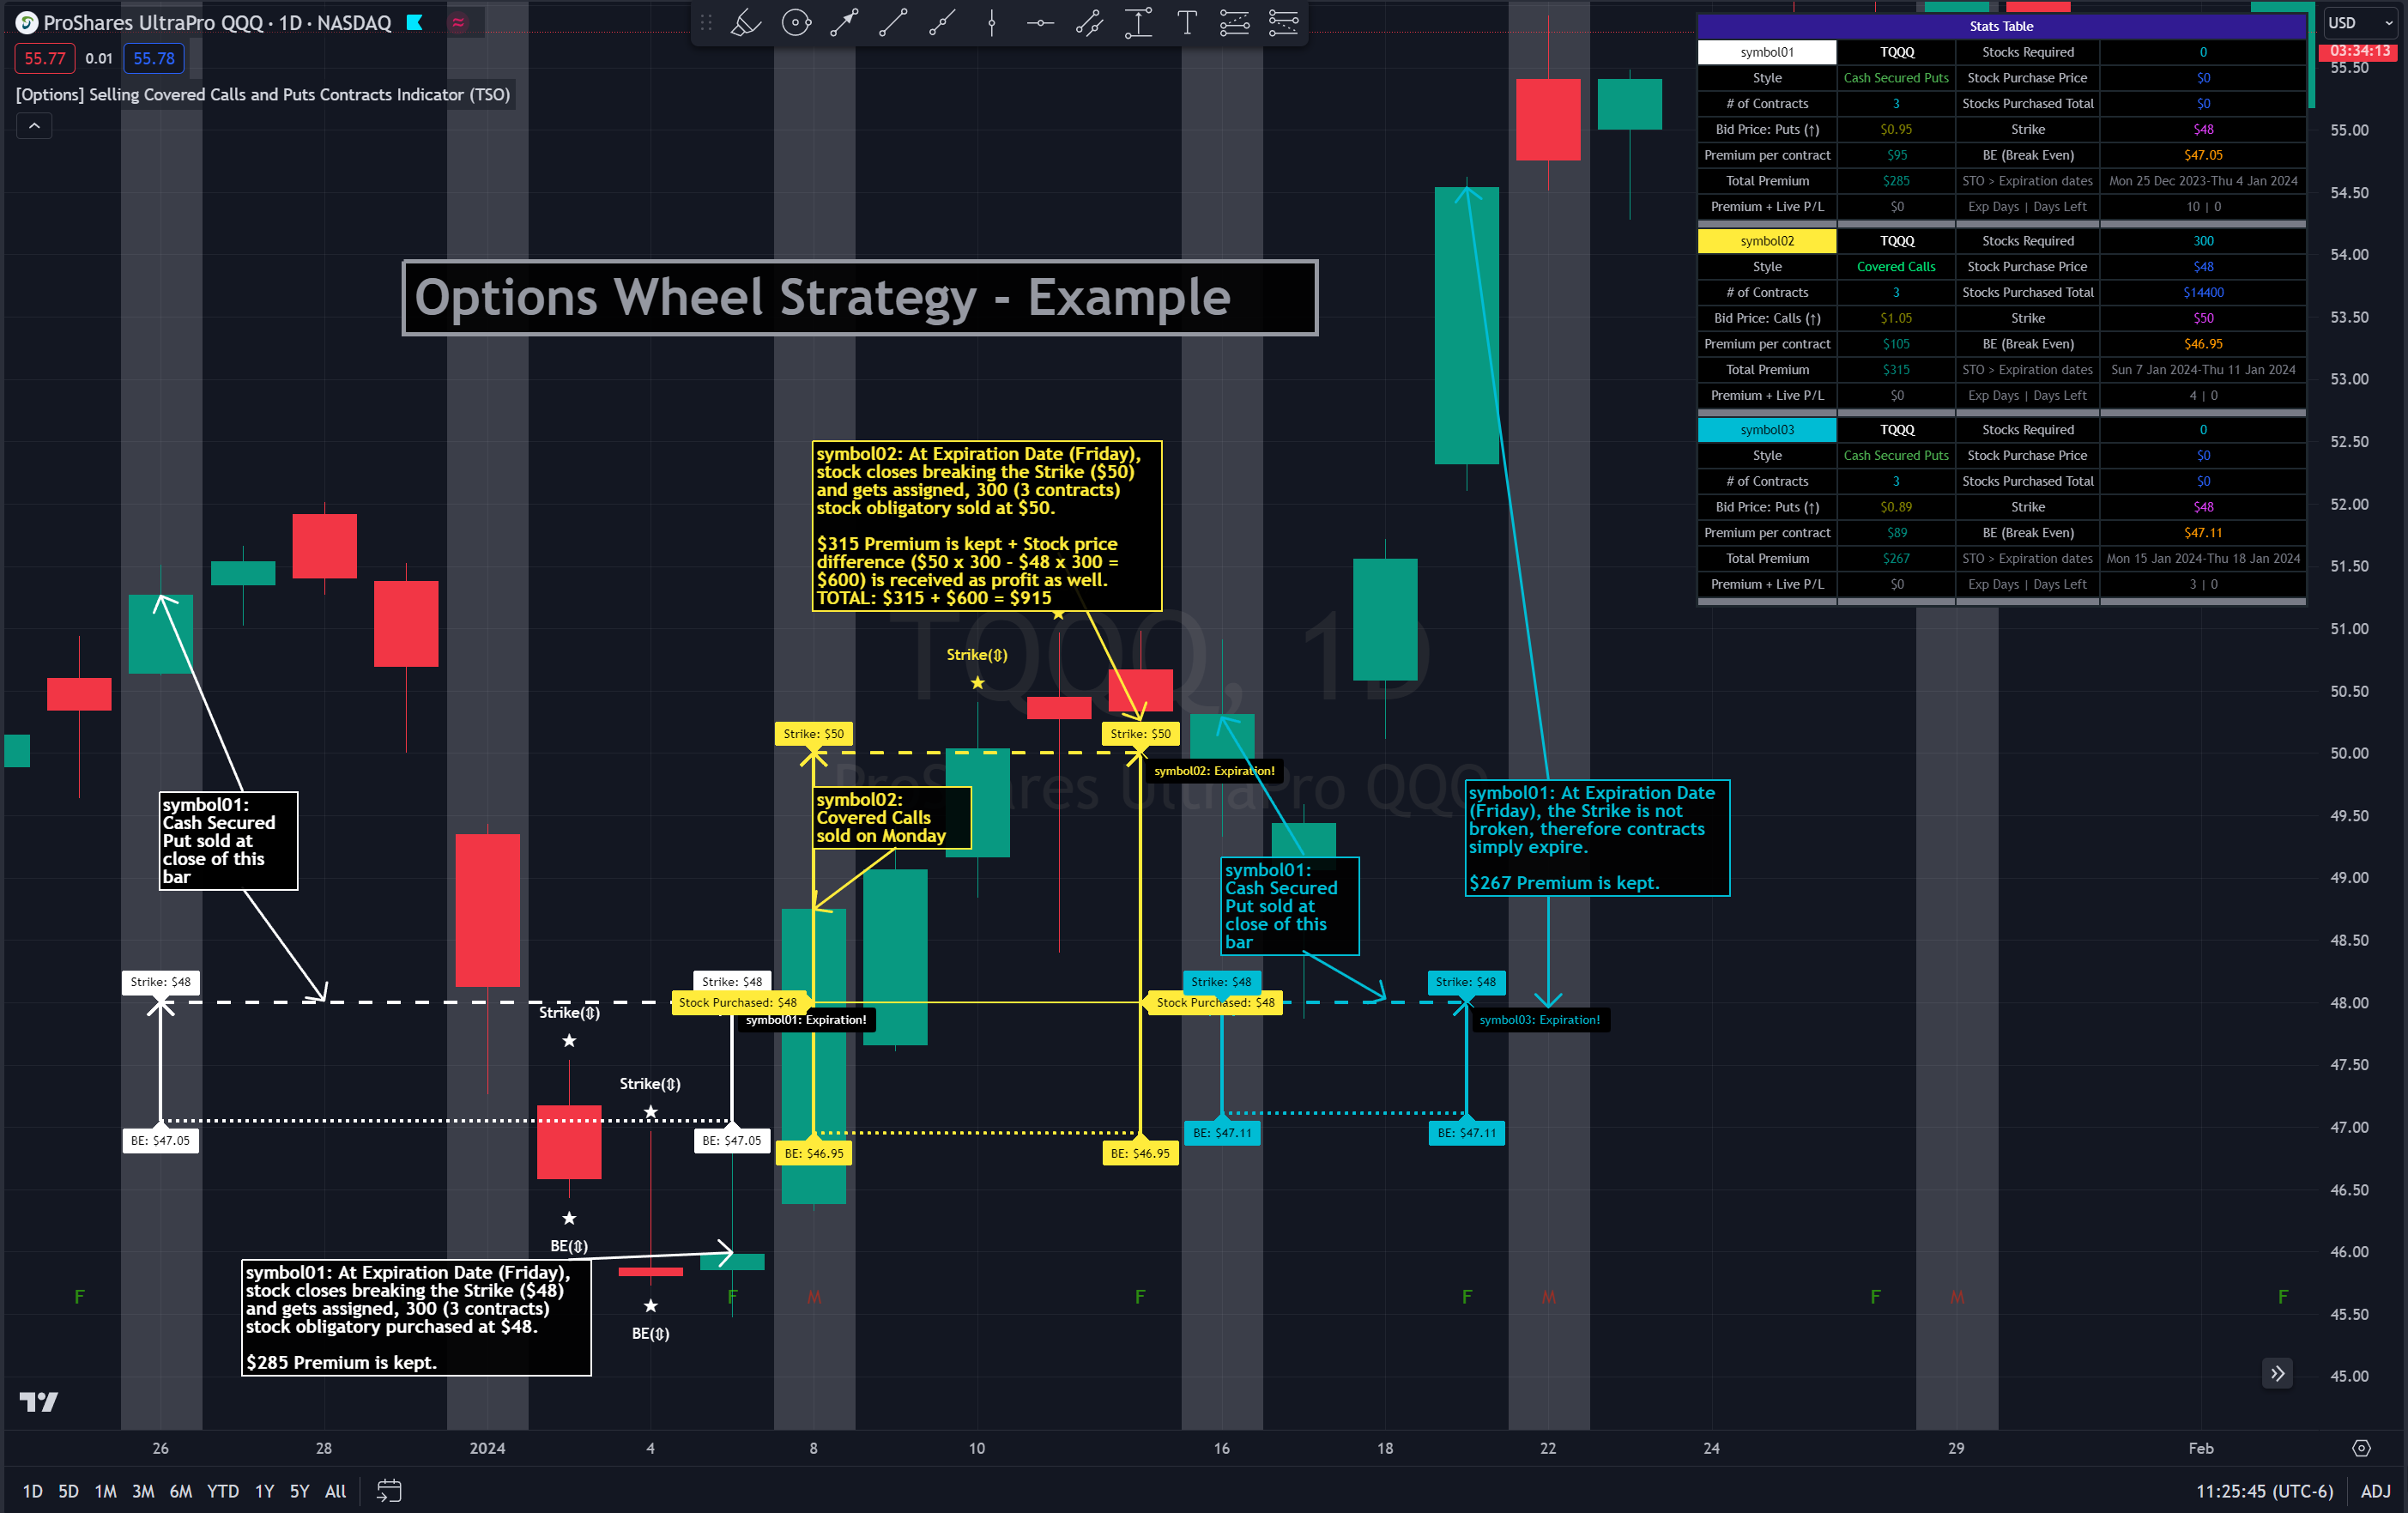
Trade Open Trigger (Bullish/Sideway)
- Options Wheel strategy combines Cash Secured Puts with Covered Calls, so a steady bullish trend is preferred with lower volatility.
- It's best to start with Cash Secured Puts until assignment hits (stocks purchased), then switch to Covered Calls until assignment hits (stocks sold) and so on.
-
TP (Take-Profit)
- Contracts Expire at Expiration date: Premium received for selling contracts kept.
- Assignment: Premium received for selling contracts kept. Stock is assigned (purchased if Cash Secured Puts were sold | sold if Covered Calls were sold [with Strike slightly above stock purchase price > the difference is also a profit]).
-
BE/SL (Break Even Stop-Loss)
- Assignment is the stop-loss for this strategy, which ends current trade and starts next one. It is not a direct loss, but could result a long unrealized losses if after stock purchase assignment it goes down for a while or even a complete loss if low-cap company is used and it goes out of business.
-
BE/SL distance can still be increased/kept optimal: for wider BE/SL > Bid Price needs to be increased:
- Set longer Expiration date.
- Set closer Strike price.
With longer Expiration date and closer Strike, chances of assignment increase as well. It's best to find an optimal level, where BE/SL is behind a Support/Resistance level and/or an established Trend Line and/or Large Length Moving Average, yet not extremely far away.
Trading Indicator
![]() Instructions
Instructions ![]() How-to
How-to
(Click or Tap to expand)
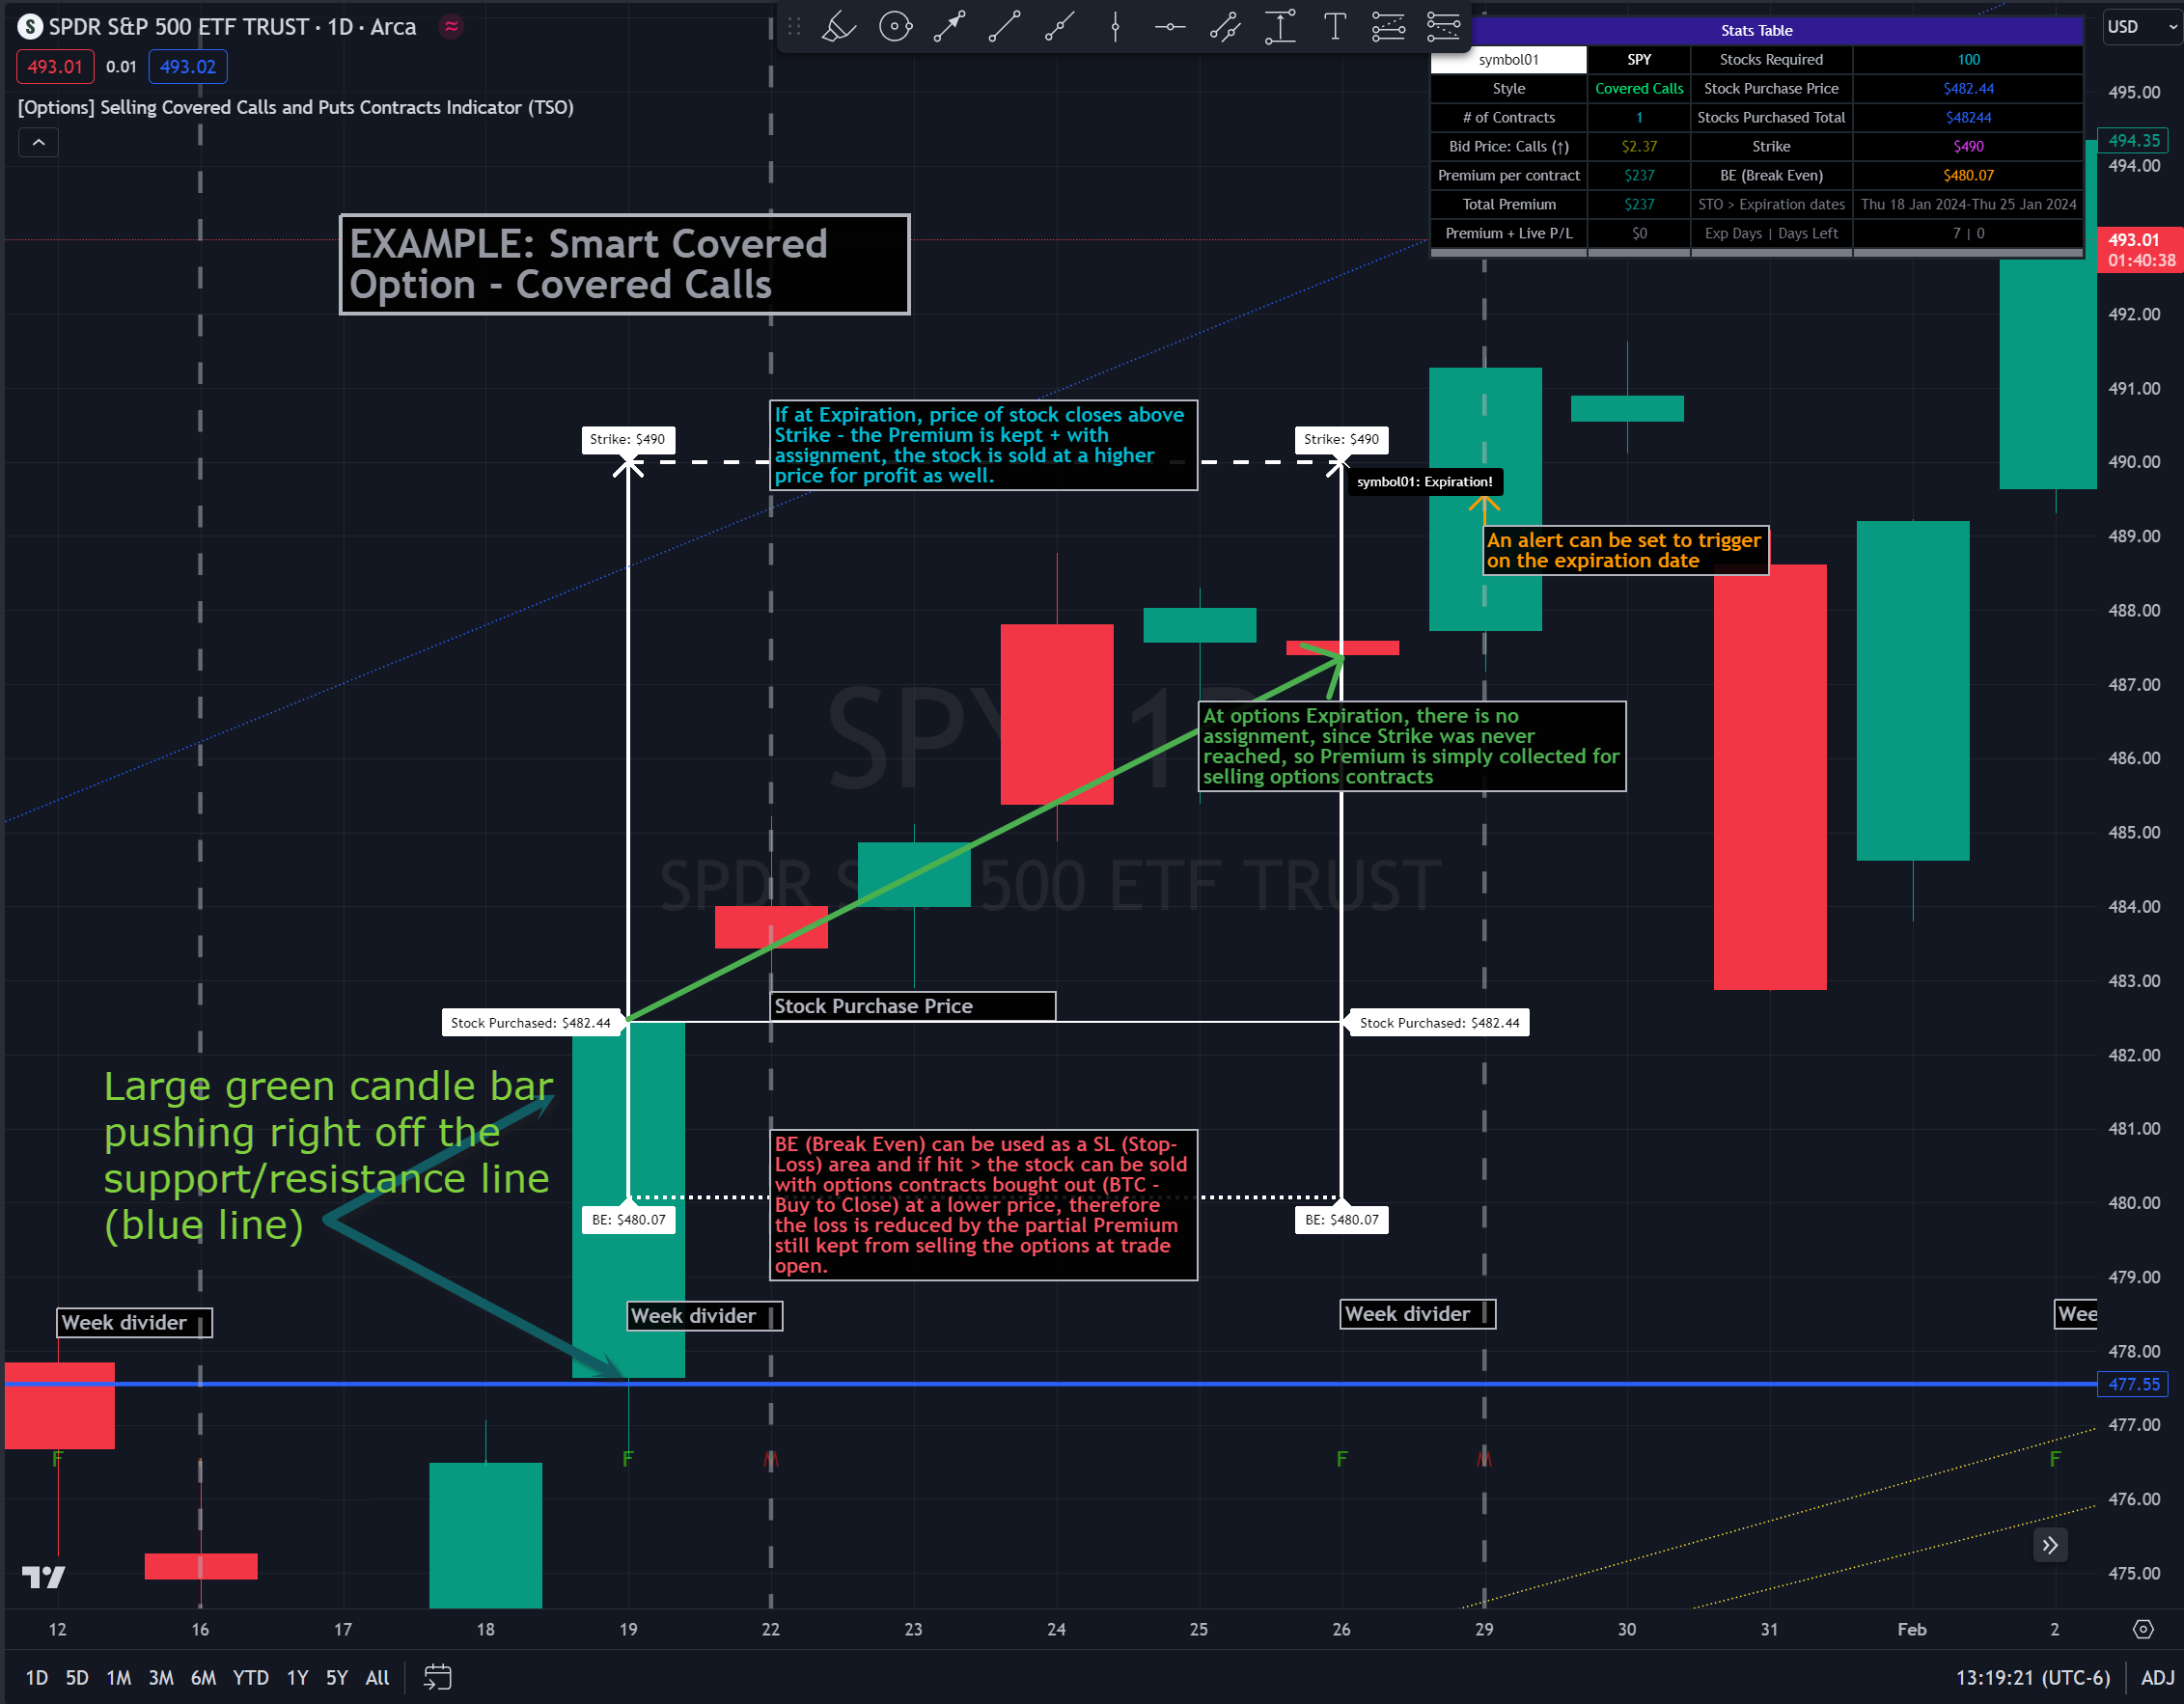
- Up to 3 instruments/symbols trade monitoring per 1 indicator instance (can add indicator several times to the chart for more instruments/symbols to be monitored).
- An Alert created in a few clicks notifying on critical level breaches such as Break Even (BE) and Strike, along with notifications for Options Expiration day, ensuring traders are promptly informed of significant developments in their positions.
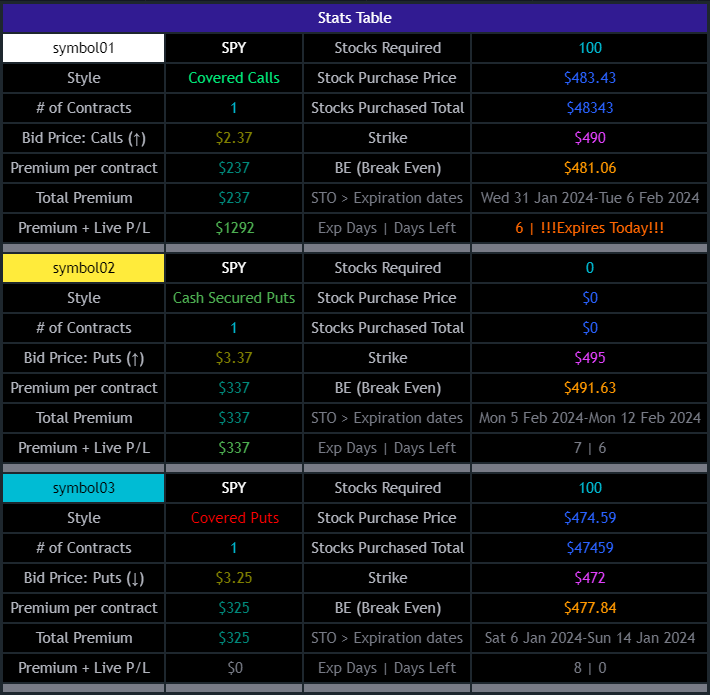
- The Stats Table provides essential information, including total premium received for options, total premium + live profit/loss of the purchased stock, and the number of days remaining until options expire, enabling traders to monitor their positions and assess profitability.
-
There are 3 styles: Covered Calls, Covered Puts, Cashed Secured Puts.
- There are 3 symbol templates, the color can be changed for each and each symbol template can be unchecked to be fully hidden or all 3 can be used.
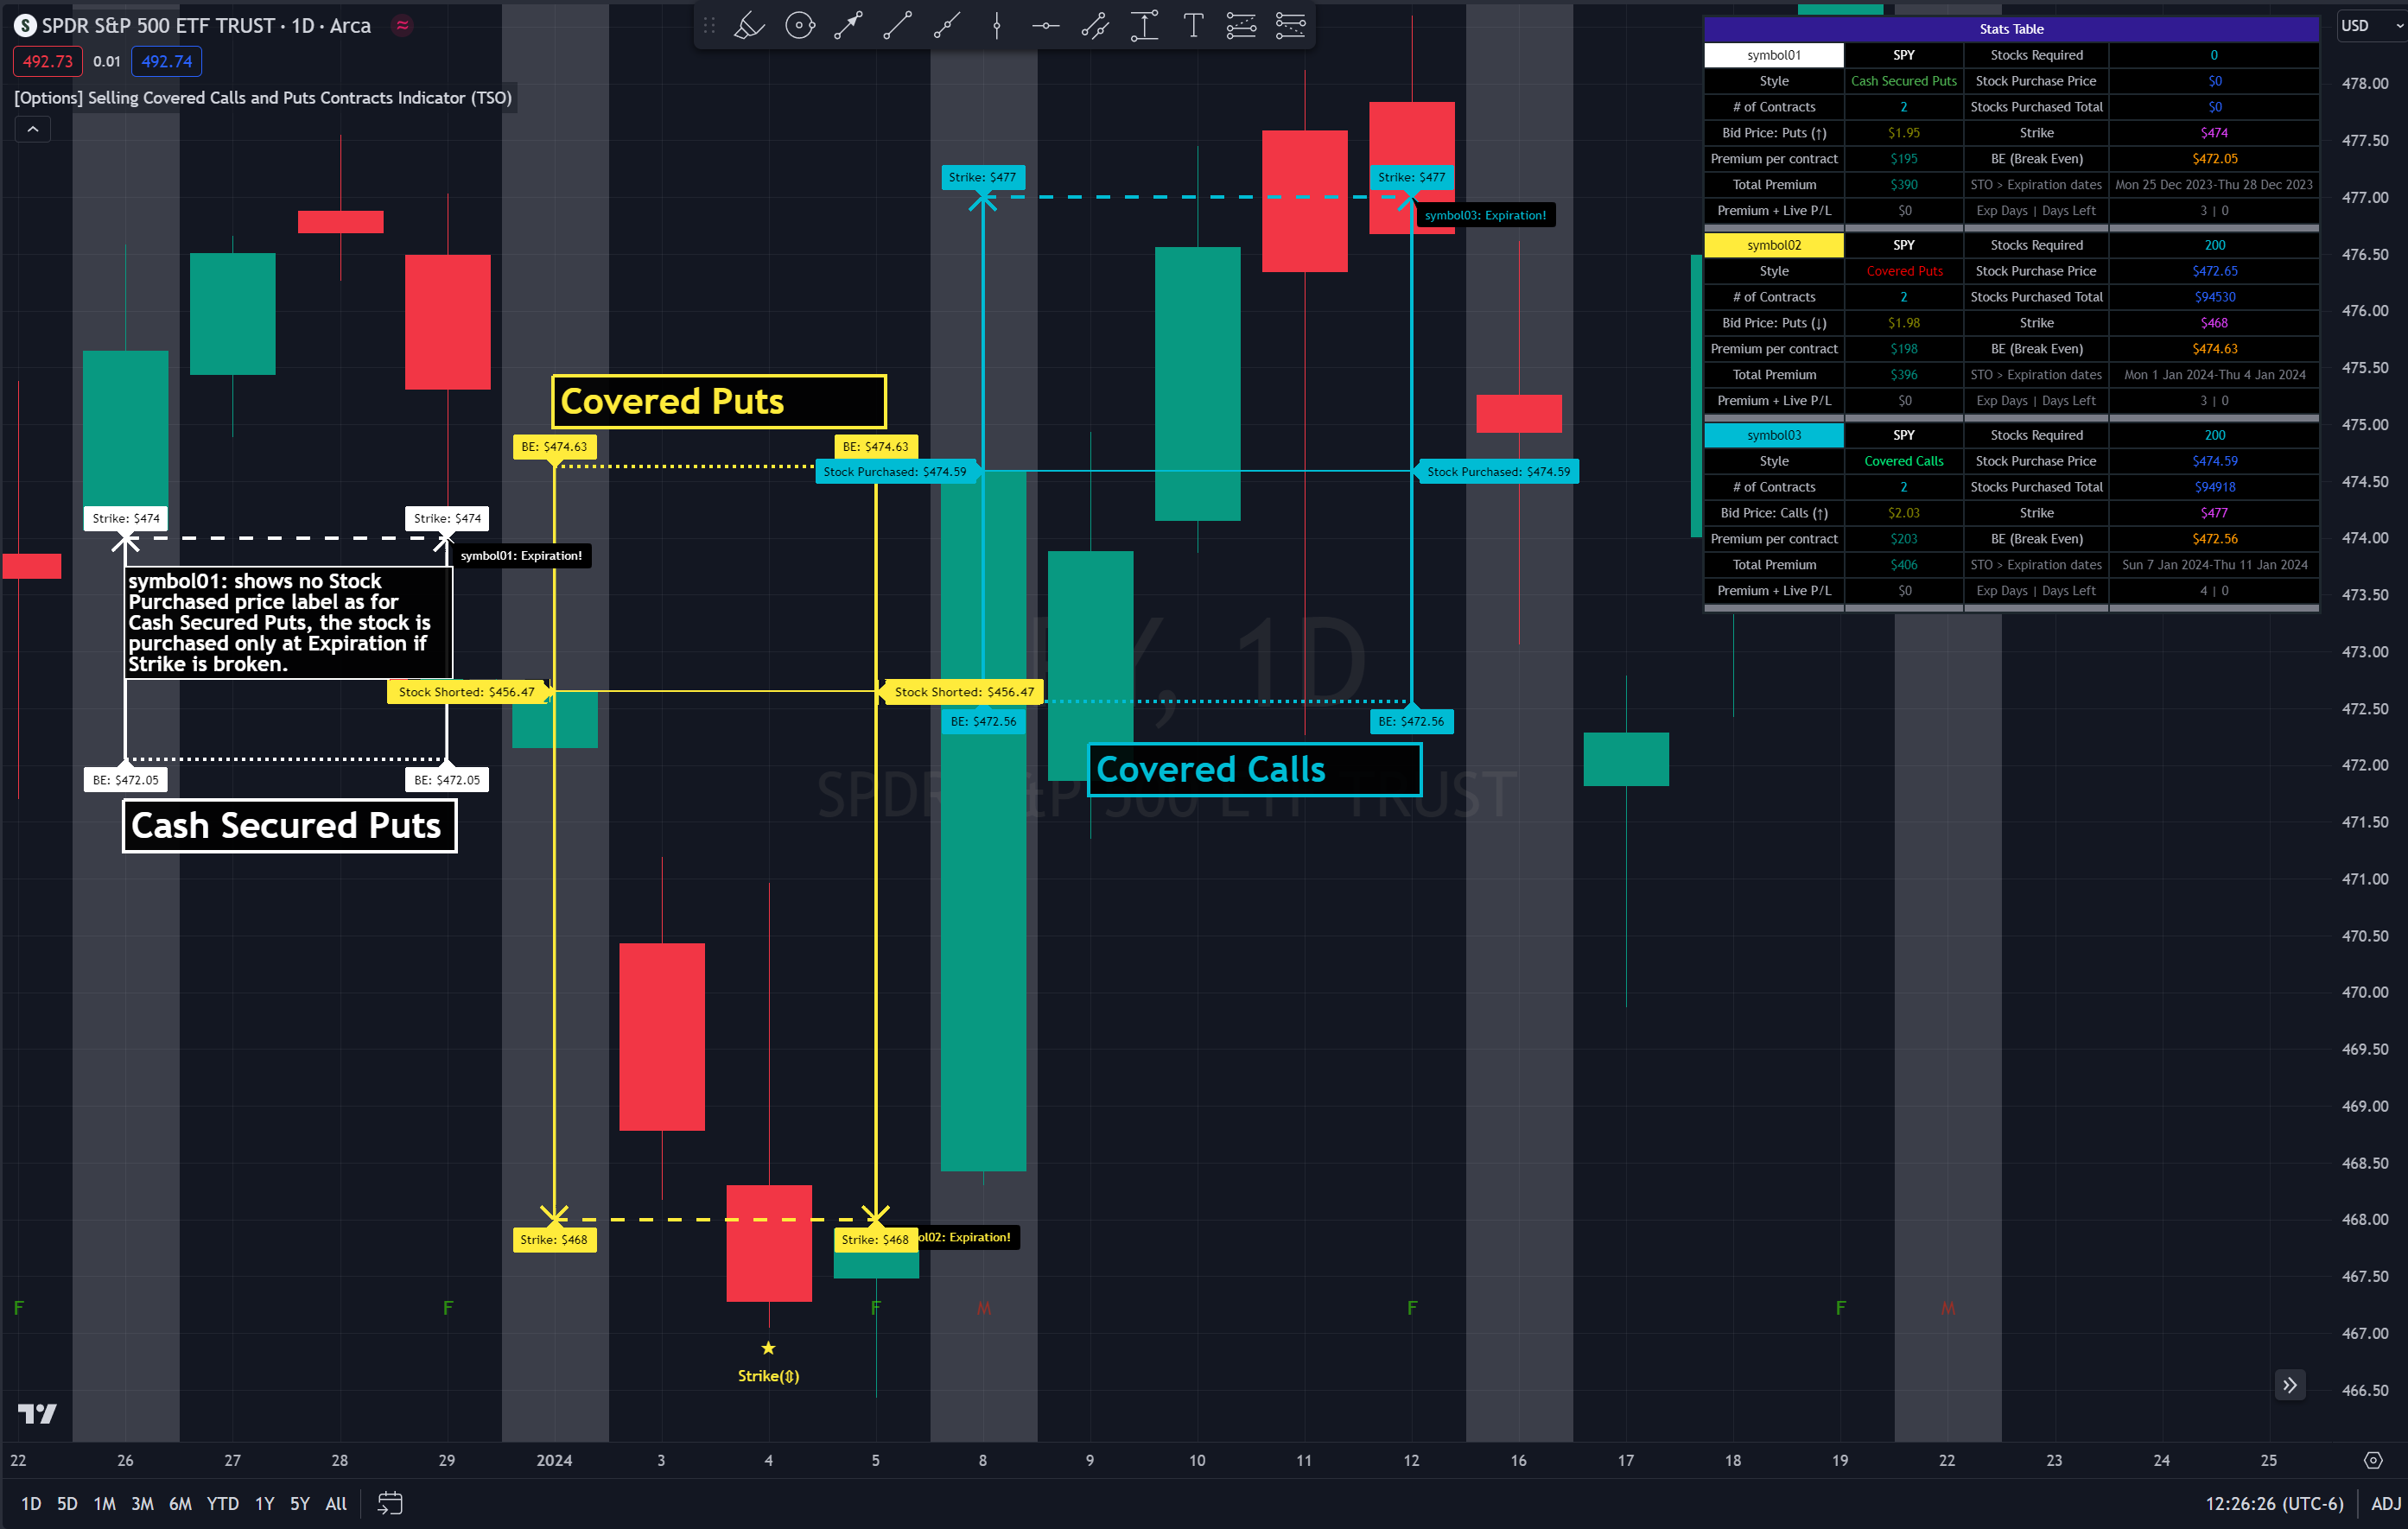
- Strike: dashed horizontal line plotted at chosen Strike, if Strike is hit within the Date Range - there will be a label shown.
- BE (Break Even): dotted horizontal line plotted at calculated BE, if BE is hit within the Date Range - there will be a label shown.
- Stock Purchased: solid horizontal line plotted at input price at which the stock was purchased.
- Date Range (STO[contracts sold] >>> Expiration[contracts expire]): vertical lines with arrows (arrows direction is based on the approach), which connect Strike, BE (Break Even) and Stock Purchased creating an square/rectangle of the whole trade, making it easy to see everything at once.
- Stats Table: shows all the necessary data for each symbol.
-
OPTIONS SETUP: SYMBOL0X | (identical for all 3 symbols)
>>> Symbol0X | Show Table: Turns on symbol01, all visuals on chart, calculations, etc. Table can be separately hidden if desired.
>>> Label Size: Size of the labels on chart showing Strike, BE (Break Even), etc.
>>> Label Color: Color for all symbol0X labels.
>>> Text Color: Text color for all symbol0X labels.
>>> Options Trading Style: 1)Covered Calls: Bullish-sideways market approach (need to own 100 shares of stock per each contract sold), Strike price has to be set above the current stock price | 2)Covered Puts: Bearish-sideways market approach (need to own 100 shares of stock per each contract sold), Strike price has to be set below the current stock price | 3)Cash Secured Puts: Bullish-sideways approach (need to have enough cash to acquire shares [100 shares per each contract] at Strike price if hit), Strike price has to be set below the current stock price.
>>> # of contracts sold (1 contract > 100shares): # of contracts sold per trade, for Covered Calls and Covered Puts, every contract must be backed up by 100shares of the underlying stock.
>>> Price per 1 contract (Bid): Premium received per each contract sold.
>>> Strike Price.
>>> Stock Purchase Price: Stock purchase price (NOTE: This is only for Covered Call and Covered Puts, for Secured Cash Puts - stock is only purchased if at Expiration it closes beyond Strike price).
>>> STO (Sell to Open) Date: date at which the contracts were sold and Premium received.
>>> Exp (Expiration) Date: date at which contracts expire, if price never breaks the Strike at Expiration - contracts become worthless!
>>> Alert/Label: Futures Expire Soon: With this setting turned on, an Alert will trigger and a Label will be shown at opening of the first candle bar on the Expiration date. It will certainly be before the end of the day, however depending on the chart TimeFrame during alert creation - it may trigger at a different time. For Example: On a Daily chart TimeFrame SPY (S&P500) will trigger such alert at 9:30AM ET. ||| NOTE: Due to difference in timezones - the solid lines representing the STO >>> Exp range may be off by 1 business day from the date input in the indicator Settings > Inputs, so double check and calibrate the date by setting it 1 day behind/ahead from actual dates so that Alert is received on the actual Expiration date.
>>> Strike price Broken - Style: 'Close': Show/Alert Strike price broken only once candle bar is closed | 'Live': Show/Alert Strike price broken immediately once it happens, before candle bar is closed.
>>> Strike price Broken: will show a label near candle bar breaking the Strike price.
>>> Alert: Strike price Broken: will alert at price breaking the Strike price.
>>> BE (Break Even) price Broken - Alert Style: 'Close': Show/Alert BE (Break Even) price broken only once candle bar is closed | 'Live': Show/Alert BE (Break Even) price broken immediately once it happens, before candle bar is closed.
>>> BE (Break Even) price Broken: will show a label near candle bar breaking the BE price.
>>> Alert: BE (Break Even) price Broken: will alert at price breaking the BE price.
![[Options Strategies] Selling Covered Calls and Puts](img/screenshots/1.3_smart_covered_options_main_example_with_explanations.png)
-
TA: TREND LINES
>>> Trend Lines - Uptrend/downtrend colors.
>>> Trend Lines: Show/Hide trend lines.
>>> Trend Line Breaks: Show/Hide labels where trend lines were broken.
>>> Alert: Trend Line Breaks: Alert when trend line is broken.
>>> Trend Lines - Search - Left Bars / Trend Lines - Search - Right Bars: how many candle bars will be used to calculate Trend Lines, the bigger the number > the more precise and less amount of trend lines will be found.
>>> Trend Lines - Extend Setting. -
TA: S&R (SUPPORT AND RESISTANCE)
>>> S&R (Support and Resistance) - Support/Resistance colors.
>>> S&R (Support and Resistance) Top/Bottom Levels.
>>> S&R (Support and Resistance) Top/Bottom Level Breaks: Show/Hide labels where support/resistance levels were broken.
>>> Alert: S&R (Support and Resistance) Top/Bottom Level Breaks: Alert when S&R (Support and Resistance) level is broken.
>>> S&R (Support and Resistance) - Search - Left Bars / S&R (Support and Resistance) - Search - Right Bars: how many candle bars will be used to calculate S&R (Support & Resistance) Levels, the bigger the number > the more precise and less amount of support and resistance levels will be found.
>>> S&R Search - Custom Resolution: This is a custom timeframe setting specifically for S&R Search, it disregards current chart timeframe. This is great to use for scalping, for example: with main chart set to 1min and the custom timeframe set to 3min or 5min - there will be stronger support/resistance levels with more detailed price action. -
TA: ADDITIONAL TOOLS
>>> MA (Moving Average).
>>> ATR (Average True Range).
-
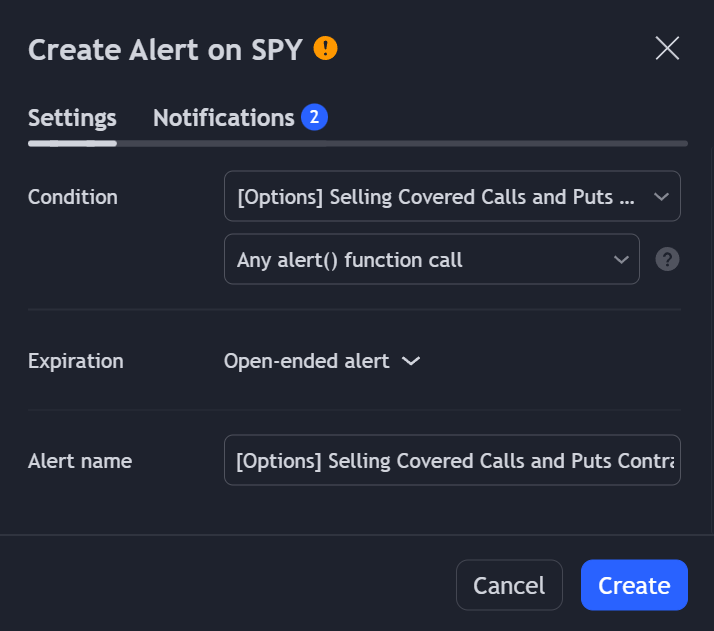
Adding Alerts in TradngView:
-Add indicator to chart and make sure to check/uncheck which alerts are required, then simply create it.
-Right-click anywhere on the TradingView chart.
-Click on Add alert.
-Condition: Select this indicator by it’s name.
-Immediately below, change it to "alert() function calls only".
-Expiration: Open-ended (that may require higher tier TradingView account, otherwise the alert will need to be occasionally re-triggered)
-Alert name: Anything
-Hit “Create”
-Note: If ANY Settings within the indicator will be changed > DELETE the current alert and create a new one per steps above, otherwise it will continue triggering alerts per old Settings!
Check out our other indicators:
> [Camarilla Pivots] with Signal Clean Up Analysis and Alerts (TSO)
> [Day Trading Indicator] EMA Cloud Scalping (TSO)
> [Opening Range pre-Market Breakout Screener] with Alerts (TSO)
> [Opening Range Breakout] Support and Resistance with Backtest (TSO)
>>>>>> [Options Covered Calls/Puts with TA] with Alerts (TSO)
> [Round Numbers] with Signal Clean Up Analysis and Alerts (TSO)
> [Auto Trend Lines] with Backtest (TSO))
> [Pivots Consolidation Breakout Screener] with Alerts (TSO)